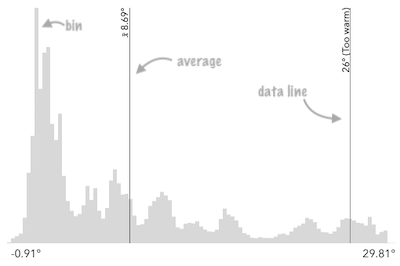
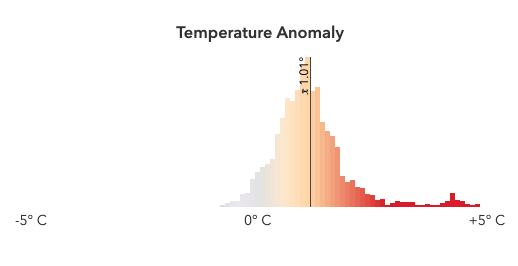
渲染直方图以基于表示存储桶或数据子范围的条柱可视化数据集的分布。每个条柱都由最小值和最大值以及总计数定义。
您可以使用直方图模块生成基础直方图的条柱。在此方案中,可以使用 fromHistogramResult() 帮助程序方法方便地从结果对象创建直方图。
const params = {
  layer: povLayer,
  field: "POP_POVERTY",
  normalizationField: "TOTPOP_CY",
  numBins: 30
};

histogram(params)
  .then(function(histogramResult) {
     const histogram = Histogram.fromHistogramResult(histogramResult);
     histogram.container = "histogram";
  })
   .catch(function(error) {
     console.log("there was an error: ", error);
   });
此微件的其他属性允许在直方图上显示有意义的值,例如平均值和 dataLines 属性。

barCreatedFunction 属性可用于根据与直方图关联的图层的渲染器中要素的颜色来设置直方图条柱的样式。

- 另请参阅:
构造函数
-
new Histogram(properties)
-
参数:properties Objectoptional
有关可能传递到构造函数中的所有属性的列表,请参阅属性。
示例:// typical usage const histogram = new Histogram({ bins: [{ minValue: 0, maxValue: 20, count: 1 }, { minValue: 21, maxValue: 40, count: 60 },{ minValue: 41, maxValue: 60, count: 239 },{ minValue: 61, maxValue: 80, count: 88 },{ minValue: 81, maxValue: 100, count: 20 }], max: 100, min: 0, average: 44 });
属性概述
| 名称 | 类型 | 描述 | 类: | |
|---|---|---|---|---|
| Number | 更多详情 直方图中数据的统计平均值。 | 更多详情 | Histogram | |
| BarCreatedFunction | 更多详情 用于设置表示直方图条柱的样式的函数。 | 更多详情 | Histogram | |
| Bin[] | 更多详情 表示直方图中每个条柱的对象数组。 | 更多详情 | Histogram | |
| String|HTMLElement | 更多详情 表示包含微件的 DOM 元素的 ID 或节点。 | 更多详情 | Widget | |
| DataLineCreatedFunction | 更多详情 每次创建数据线时触发的函数。 | 更多详情 | Histogram | |
| Object[] | 更多详情 设置后,将在直方图上渲染向最终用户指示重要或有意义的值的线条。 | 更多详情 | Histogram | |
| String | 更多详情 类的名称。 | 更多详情 | Accessor | |
| String | 更多详情 创建微件时分配给微件的唯一 ID。 | 更多详情 | Widget | |
| String | 更多详情 微件的默认标注。 | 更多详情 | Histogram | |
| LabelFormatter | 更多详情 用于设置直方图上标注格式的函数。 | 更多详情 | Histogram | |
| String | 更多详情 确定直方图微件的方向。 | 更多详情 | Histogram | |
| Number | 更多详情 整个直方图的最大值或边界。 | 更多详情 | Histogram | |
| Number | 更多详情 整个直方图的最小值或边界。 | 更多详情 | Histogram | |
| String | 更多详情 微件的状态。 | 更多详情 | Histogram | |
| HistogramViewModel | 更多详情 直方图微件的视图模型。 | 更多详情 | Histogram | |
| Boolean | 更多详情 指示微件是否可见。 | 更多详情 | Widget |
属性详细信息
-
average Number
-
直方图中数据的统计平均值。您通常从 SummaryStatisticsResult 的
avg属性中获取此值,这是 summaryStatistics 函数的结果。设置后,此值将在直方图上渲染,并带有指示其为平均值的符号。
- 另请参阅:
示例:// sets result returned from a smart mapping method // to the histogram histogram.average = response.statistics.avg;histogram.average = 34.5;
-
barCreatedFunction BarCreatedFunction
-
用于设置表示直方图条柱的样式的函数。这可用于对视图中具有相同颜色要素的条柱进行着色,这些要素位于表示相同数据范围的条柱中。
示例:histogram.barCreatedFunction = function(index, element){ let bin = histogram.bins[index]; let midValue = ((bin.maxValue - bin.minValue) / 2) + bin.minValue; // colors the histogram bins with a custom function // (not defined here for brevity of the snippet) for interpolating // colors from data values to match the legend let color = getColorFromValue(midValue); element.setAttribute("fill", color.toHex()); };
-
表示直方图中每个条柱的对象数组。此信息通常从直方图函数返回。
示例:// sets the bins of the histogram from the bins in the histogram() result histogram.bins = histogramResult.bins;// Creates a histogram with 7 bins. histogram.bins = [ { minValue: 0, maxValue: 10, count: 4 }, { minValue: 10.1, maxValue: 20, count: 14 }, { minValue: 20.1, maxValue: 30, count: 9 }, { minValue: 30.1, maxValue: 40, count: 34 }, { minValue: 40.1, maxValue: 50, count: 351 }, { minValue: 50.1, maxValue: 60, count: 100 }, { minValue: 60.1, maxValue: 70, count: 1 } ];
-
-
表示包含微件的 DOM 元素的 ID 或节点。此属性只能设置一次。以下示例是使用微件时的所有有效用例。
示例:// Create the HTML div element programmatically at runtime and set to the widget's container const basemapGallery = new BasemapGallery({ view: view, container: document.createElement("div") }); // Add the widget to the top-right corner of the view view.ui.add(basemapGallery, { position: "top-right" });// Specify an already-defined HTML div element in the widget's container const basemapGallery = new BasemapGallery({ view: view, container: basemapGalleryDiv }); // Add the widget to the top-right corner of the view view.ui.add(basemapGallery, { position: "top-right" }); // HTML markup <body> <div id="viewDiv"></div> <div id="basemapGalleryDiv"></div> </body>// Specify the widget while adding to the view's UI const basemapGallery = new BasemapGallery({ view: view }); // Add the widget to the top-right corner of the view view.ui.add(basemapGallery, { position: "top-right" });
-
dataLineCreatedFunction DataLineCreatedFunction
-
每次创建数据行时触发的函数。您可以使用它来设置数据轴上各个 dataLines 的样式。
示例:histogram.dataLineCreatedFunction = function (lineElement, labelElement, index) { lineElement.setAttribute("y2", "25%"); lineElement.classList.add("line-style"); };
-
设置后,将在直方图上渲染向最终用户指示重要或有意义的值的线条。
- 属性:
-
value Number
直方图数据轴上的值,将在其中渲染一条线。
optional 与行关联的标注。
示例:// will render lines at the 25th, 50th, 75th, and 99th percentiles histogram.dataLines = [{ value: 30, label: "25 pctl" }, { value: 45, label: "50 pctl" }, { value: 65, label: "75 pctl" }, { value: 89, label: "99 pctl" }];// calculate standard deviations from mean using stats // returned from smart mapping statistic methods const stddevs = smartMappingUtils.getDeviationValues(stats.stddev, stats.avg, 2); histogram.dataLines = stddevs.map(function(stddev){ return { value: stddev }; });
-
类的名称。声明的类名格式为
geoscene.folder.className。
-
创建微件时分配给构件的唯一 ID。如果未由开发人员设置,它将默认为容器 ID,或者如果不存在,则将自动生成。
-
label String
-
-
labelFormatFunction LabelFormatter
-
用于设置直方图上标注格式的函数。覆盖默认标注格式化程序。
示例:// For thumb values, rounds each label to whole numbers. slider.labelFormatFunction = function(value) { return value.toFixed(0); }
-
layout String
-
确定直方图微件的方向。
可能的值:"vertical"|"horizontal"
- 默认值:horizontal
示例:histogram.layout = "vertical";
-
max Number
-
整个直方图的最大值或边界。这应该与最后一个条柱的最大边界匹配。
示例:histogram.max = 100;// sets result returned from a smart mapping method // to the histogram histogram.max = response.statistics.max;
-
min Number
-
整个直方图的最小值或边界。这应该与第一个条柱的最小边界匹配。
示例:histogram.min = 0;// sets result returned from a smart mapping method // to the histogram histogram.min = response.statistics.min;
-
state Stringreadonly
-
微件的状态。
可能的值:"ready"|"disabled"
-
viewModel HistogramViewModel
-
直方图微件的视图模型。这是一个包含控制此微件行为的所有逻辑(属性和方法)的类。请参阅 HistogramViewModel 类以访问直方图微件上的所有属性和方法。
-
指示微件是否可见。
如果
false,则该微件将不再呈现在 web 文档中。这可能会影响文档中其他元素或微件的布局。例如,如果此微件是与视图 UI 右上角关联的三个微件中的第一个,则当此微件变为不可见时,其他微件将重新定位。有关详细信息,请参阅"none"的 CSS 显示值。- 默认值:true
示例:// Hides the widget in the view widget.visible = false;
方法概述
| 名称 | 返回类型 | 描述 | 类: | |
|---|---|---|---|---|
| String | 更多详情 用于为微件的 | 更多详情 | Widget | |
| 更多详情 销毁微件实例。 | 更多详情 | Widget | ||
| Boolean | 更多详情 在实例上发出事件。 | 更多详情 | Widget | |
| Histogram | 更多详情 一个方便函数,用于根据直方图统计函数的结果创建直方图微件实例。 | 更多详情 | Histogram | |
| Boolean | 更多详情 指示实例上是否存在与提供的事件名称匹配的事件侦听器。 | 更多详情 | Widget | |
| Boolean | 更多详情
| 更多详情 | Widget | |
| Boolean | 更多详情
| 更多详情 | Widget | |
| Boolean | 更多详情
| 更多详情 | Widget | |
| Object | 更多详情 在实例上注册事件处理程序。 | 更多详情 | Widget | |
| 更多详情 微件拆解助手。 | 更多详情 | Widget | ||
| 更多详情 此方法主要由开发人员在实现自定义微件时使用。 | 更多详情 | Widget | ||
| Object | 更多详情 此方法主要由开发人员在实现自定义微件时使用。 | 更多详情 | Widget | |
| 更多详情 立即将微件渲染给 DOM。 | 更多详情 | Widget | ||
| 更多详情 此方法主要由开发人员在实现自定义微件时使用。 | 更多详情 | Widget | ||
| Promise | 更多详情
| 更多详情 | Widget |
方法详细信息
-
用于为微件的
class属性构建值的实用程序方法。这有助于简化 CSS 类设置。参数:repeatable 类名称
返回:类型 说明 String 计算的类名。 - 另请参阅:
示例:// .tsx syntax showing how to set CSS classes while rendering the widget render() { const dynamicIconClasses = { [CSS.myIcon]: this.showIcon, [CSS.greyIcon]: !this.showIcon }; return ( <div class={classes(CSS.root, CSS.mixin, dynamicIconClasses)} /> ); }
-
destroy()inherited
-
销毁微件实例。
-
在实例上发出事件。仅当创建此类的子类时,才应使用此方法。
参数:type String事件的名称。
event Objectoptional事件负载。
返回:类型 说明 Boolean true如果听取了侦听者的通知
-
-
一个方便函数,用于根据直方图统计函数的结果创建直方图微件实例。
参数:result HistogramResult直方图统计函数的结果,用于为图层中的字段或表达式生成直方图。
返回:类型 说明 Histogram 表示从直方图返回的直方图的直方图实例。 示例:let colorParams = { layer: povLayer, basemap: map.basemap, field: "POP_POVERTY", normalizationField: "TOTPOP_CY", theme: "above-and-below" }; let stats = null; colorRendererCreator .createContinuousRenderer(colorParams) .then(function(response) { // set the renderer to the layer and add it to the map stats = response.statistics; return histogram({ layer: povLayer, field: "POP_POVERTY", normalizationField: "TOTPOP_CY", numBins: 100 }); }) .then(function(histogramResult) { let histogram = Histogram.fromHistogramResult(histogramResult); histogram.container = "histogram"; histogram.average = stats.avg; }) .catch(function(error) { console.log("there was an error: ", error); });
-
起始版本:GeoScene API for JavaScript 4.19
-
isFulfilled()可用于验证是否满足类的创建实例(已解决或已拒绝)。如果已完成,将返回true。返回:类型 说明 Boolean 指示是否已完成创建类的实例(已解决或已拒绝)。
-
起始版本:GeoScene API for JavaScript 4.19
-
isRejected()可用于验证创建类的实例是否被拒绝。如果被拒绝,将返回true。返回:类型 说明 Boolean 指示创建类的实例是否已被拒绝。
-
起始版本:GeoScene API for JavaScript 4.19
-
isResolved()可用于验证是否解析了类的创建实例。如果被解析,将返回true。返回:类型 说明 Boolean 指示是否已解析创建类的实例。
-
在实例上注册事件处理程序。调用此方法将事件与侦听器挂钩。
参数:要侦听的事件或事件数组。
listener Function事件激发时要调用的函数。
返回:类型 说明 Object 返回具有 remove()方法的事件处理程序,应调用该方法以停止侦听事件。属性 类型 说明 remove 函数 调用时,从事件中删除侦听器。 示例:view.on("click", function(event){ // event is the event handle returned after the event fires. console.log(event.mapPoint); });
-
own(handles)inherited
-
微件拆解助手。当微件被销毁时,添加到其中的任何句柄都将自动删除。
参数:handles WatchHandle|WatchHandle[]在微件被销毁后标记为删除的句柄。
-
postInitialize()inherited
-
此方法主要由开发人员在实现自定义微件时使用。在微件准备好进行渲染后执行。
-
此方法主要由开发人员在实现自定义微件时使用。它必须由子类实现以进行渲染。
返回:类型 说明 Object 渲染的虚拟节点。
-
renderNow()inherited
-
立即将微件渲染给 DOM。
-
scheduleRender()inherited
-
此方法主要由开发人员在实现自定义微件时使用。计划微件渲染。此方法对于影响 UI 的更改很有用。
-
起始版本:GeoScene API for JavaScript 4.19
-
when()可以在创建类的实例后利用。此方法采用两个输入参数:callback函数和errback函数。在类的实例加载时执行callback。如果类的实例无法加载,则执行errback。参数:callback Functionoptional解析 promise 时要调用的函数。
errback Functionoptionalpromise 失败时要执行的函数。
返回:类型 说明 Promise 返回回调结果的新 promise, callback结果可用于链接其他函数。示例:// Although this example uses the BasemapGallery widget, any class instance that is a promise may use when() in the same way let bmGallery = new BasemapGallery(); bmGallery.when(function(){ // This function will execute once the promise is resolved }, function(error){ // This function will execute if the promise is rejected due to an error });
类型定义
-
BarCreatedFunction(index, element)
-
用于设置直方图条柱样式或将自定义交互附加到直方图条柱的函数。此函数应设置为 barCreatedFunction 属性。它在创建时为每个条柱触发。
参数:index Number直方图柱的索引。这直接对应于关联条柱的索引。
element SVGElement要设置样式的直方图条柱元素。
-
Bin
-
表示直方图的条柱。条柱由最小值、最大值和计数组成。它指示数据集中介于最小值和最大值之间的值的数量。
-
DataLineCreatedFunction(lineElement, labelElement, index)
-
用于设置 dataLines 样式的函数。此函数应设置为 dataLineCreatedFunction 属性。它在创建每个数据线时触发。
参数:lineElement SVGElement表示直方图上渲染的数据线的 SVG 元素。
labelElement SVGElementoptionalSVG 元素,表示在关联线元素的直方图上渲染的标注。
index Numberoptional数据线的索引。