Arcade 是一种表达式语言,可以在 GeoScene 应用程序(即 GeoScene Pro、GeoScene Online、GeoScene Runtime API 和 GeoScene API for JavaScript)中执行数学计算和评估可视化、弹出式内容和标注中的逻辑语句。在其中一种产品中编写表达式时,可以将其保存到 webmap、加载并在其他应用程序中进行评估。这使您可以灵活地定义可在任何 GeoScene 应用程序中一致地保存和评估的自定义内容。
在许多方面,Arcade 的语法类似于 JavaScript,允许您声明变量、执行逻辑运算、利用内置函数以及编写自定义函数。但是,这两种语言之间存在关键差异。阅读完整的 Arcade 文档,包括指南和函数参考,了解如何编写 Arcade 表达式的详细信息。您还可以访问为使用测试数据集测试表达式提供的环境。
全局变量 可使表达式能够访问连接到图层、地图或工作空间的数据值。这些值是表达式的输入,是生成表达式作者定义的有效返回值所必需的。例如,$feature 提供了对要素属性和几何的表达式访问。
在 JavaScript 应用程序中,Arcade 表达式始终作为字符串值引用。编写单行表达式时,可以简单地将其用双引号或单引号括起来。
1
2
// 返回 18 岁及以上人口的百分比
renderer.valueExpression = "Round( ($feature.AGE_18UP / $feature.TOTAL_POP) * 100 )" ;
您可以使用模板文字 (ES6 或更高版本)来编写多行 Arcade 表达式。
1
2
3
4
5
6
7
8
9
10
renderer.valueExpression = `
var republican = $feature.MP06025a_B;
var democrat = $feature.MP06024a_B;
var independent = $feature.MP06026a_B;
var parties = [ republican, democrat, independent ];
var total = Sum(parties);
var max = Max(parties);
return (max / total) * 100;
` ;
请记住,Arcade 文本值也支持模板字面量。由于 Arcade 表达式在 GeoScene API for JavaScript 中存储为字符串,因此它们通常使用 JavaScript 中的模板字面量编写。您仍然可以在 JavaScript 模板字面量中使用 Arcade 模板字面量,但需要转义关键字符,例如反引号和美元符号,以便识别 Arcade 模板字面量。例如,请注意在 PopupTemplate 中使用 JavaScript 模板字面量中的模板字面量的 Arcade 表达式:
1
2
3
4
5
6
7
8
9
10
11
12
13
14
15
16
17
18
19
20
21
22
layer.popupTemplate = {
content : "{expression/percent-unemployed}" ,
expressionInfos : [
{
name : "percent-unemployed" ,
title : "Percent unemployed" ,
expression : `
var unemploymentRate = ( $feature.UNEMP_CY / $feature.LABOR_FORCE ) * 100;
var population = $feature.POP_16UP;
var populationNotWorking = ( ( $feature.UNEMP_CY + $feature.NOT_LABORFORCE_16 ) / $feature.POP_16UP ) * 100;
// returns a string built using an Arcade template literal
return \`\${$feature.COUNTY} County
- Unemployment rate: \${Text(unemploymentRate, "##.#")}%
- % population not working: \${Text(populationNotWorking, "##.#")}%
- Population: \${Text(population, "#,###")}\`
`
}
]
}
在弹出窗口中汇总相交点 示例演示了 Arcade 模板字面量的另一个示例。如果您不编写 ES6 代码,则可以将表达式放在 JavaScript 之外的单独 <script> 标记中,并将类型设置为 text/plain 并使用唯一 ID 来引用 JavaScript 中适当位置的脚本。
1
2
3
4
5
6
7
8
9
10
< script type = "text/plain" id = "adult-population" >
var republican = $feature.MP06025a_B;
var democrat = $feature.MP06024a_B;
var independent = $feature.MP06026a_B;
var parties = [ republican, democrat, independent ];
var total = Sum(parties);
var max = Max(parties);
return (max / total) * 100 ;
</ script >
然后通过调用 document.getElementById() 方法将脚本作为字符串值引用。
1
renderer.valueExpression = document .getElementById( "adult-population" ).text;
有关更多内容,请参阅以下示例片段和使用 Arcade 创建自定义可视化 示例。
Arcade 只能在有效的配置文件 中执行。配置文件定义了用于编写有效表达式的规则或规范。这包括定义有效的数据输入(全局变量)、受支持的函数和返回类型,以及它们可以执行的上下文。
Arcade 是独立的,并在逐个功能的基础上执行。配置文件可确保表达式在它们执行的上下文中是安全和高性能的。例如,Arcade 允许您定义驱动可视化的数据值。如果您的图层具有 100,000 个要素,并具有使用 Arcade 表达式定义的渲染器,则该表达式必须执行 100,000 次才能正确渲染数据。因此,可视化配置文件 会阻止您从原始要素之外的源访问数据,因为这会严重降低应用程序的性能。然而,在弹出窗口 中,您可在 Arcade 表达式中访问来自地图或服务的任何图层中的数据,因为一次只执行一个表达式(当打开弹出窗口时),因此您可以执行此操作。
以下部分描述了 JavaScript API 中可以编写 Arcade 表达式的位置。每个都提供了到配置文件规范的链接,这些规范定义了给定上下文的表达式规则以及实时示例。
Arcade 用于为 FeatureLayer 或 SceneLayer 中的要素创建标注 表达式。从 API 4.5 版开始,这是标注要素唯一支持的方法。您必须向图层的 labelingInfo 属性添加至少一个 LabelClass 。Arcade 表达式必须作为字符串值传递给 LabelClass 的 labelExpressionInfo 对象的 expression 属性。
1
2
3
4
5
6
7
8
9
10
11
12
13
14
15
16
17
18
19
20
21
22
23
24
25
26
27
28
// 返回图层中字段的值
// 该字段的值将是每个功能的标签
const arcade = "$feature.STATION_NAME" ;
// 此对象自动转换为 new LabelClass()
const labelClass = {
// 将 arcade 表达式设置为 labelExpressionInfo 的 `expression` 属性
labelExpressionInfo : {
expression : arcade
},
labelPlacement : "below-right" ,
minScale : 2500000 ,
symbol : {
type : "label-3d" ,
symbolLayers : [{
type : "text" ,
material : { color : "white" },
halo : {
color : "black" ,
size : 1
},
size : 8
}]
}
};
// 将标注类设置为要素图层
featureLayer.labelingInfo = [ labelClass ];
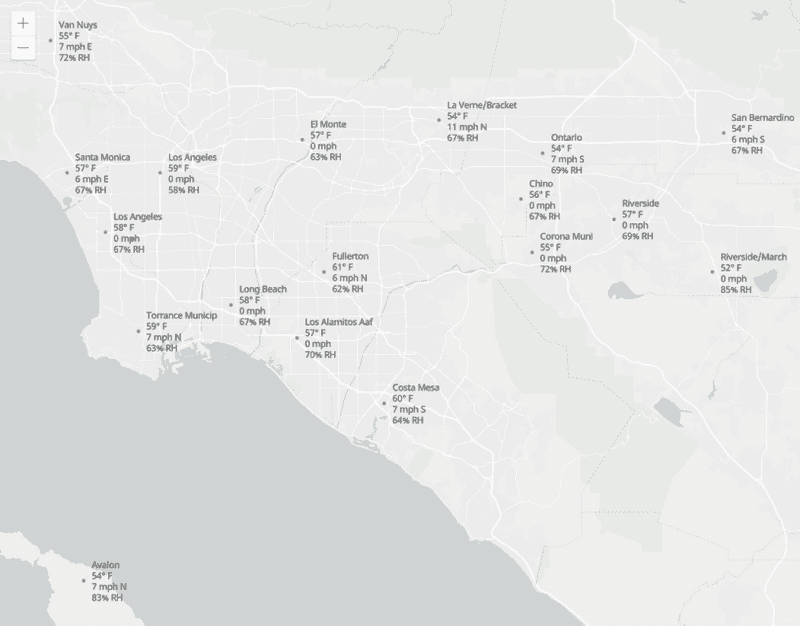
使用 Arcade 编写标注表达式可能更复杂,包含执行数学和逻辑运算的多行。例如,多行标注示例 演示了如何构建更复杂的多行标注表达式。此表达式将两个数值字段值分配给它们自己的变量,对它们求值,然后返回一个字符串值。 Arcade 的 When() 函数 用于评估风向(0-360 度之间),它返回 N、NE、E、SE、S、SW、W 或 NW 的相关罗盘方向。如果风速为 0,则不返回方向。表达式的最后一行返回标注,即 WIND 变量的值。
1
2
3
4
5
6
7
8
9
10
11
12
13
14
15
< script type = "text/plain" id = "wind-direction" >
var DEG = $feature.WIND_DIRECT;
var SPEED = $feature.WIND_SPEED;
var DIR = When( SPEED == 0 , '' ,
(DEG < 22.5 && DEG >= 0 ) || DEG > 337.5 , 'N' ,
DEG >= 22.5 && DEG < 67.5 , 'NE' ,
DEG >= 67.5 && DEG < 112.5 , 'E' ,
DEG >= 112.5 && DEG < 157.5 , 'SE' ,
DEG >= 157.5 && DEG < 202.5 , 'S' ,
DEG >= 202.5 && DEG < 247.5 , 'SW' ,
DEG >= 247.5 && DEG < 292.5 , 'W' ,
DEG >= 292.5 && DEG < 337.5 , 'NW' , '' );
var WIND = SPEED + ' mph ' + DIR;
return WIND;
</ script >
有许多额外的 Arcade 函数可用于标记,包括为文本格式提供逻辑的文本函数 。有关这些内置函数的更多信息,请参阅完整的 Arcade 文档 。
Arcade 在两个弹出配置文件中执行:
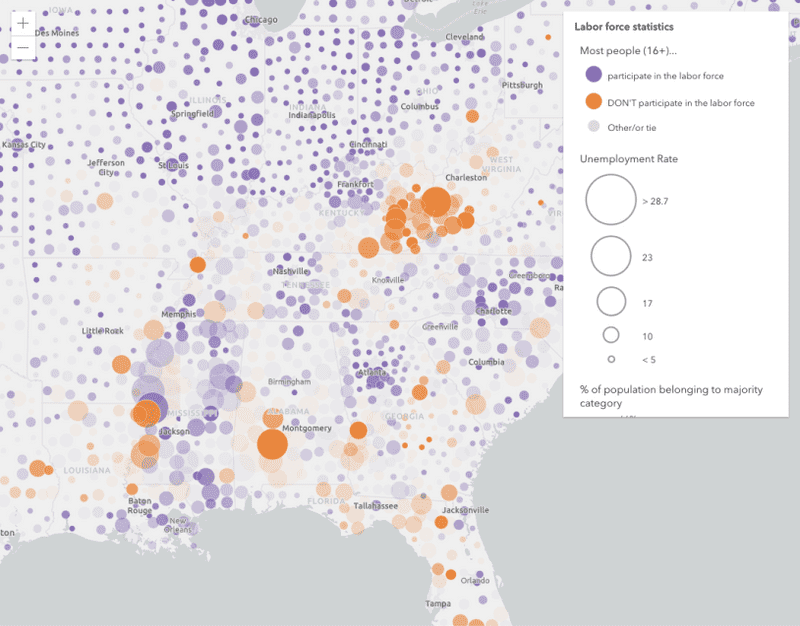
弹出窗口 - 用于计算要在图层弹出内容或要素缩减弹出窗口中显示的属性。弹出元素 - 用于有条件地在图层的弹出窗口或要素缩减弹出窗口中创建弹出元素。可以在 PopupTemplate 的内容 中引用 Arcade 表达式。当您想要显示不作为属性值出现在图层中的数据时,这非常有用。在弹出窗口配置文件中,表达式必须返回文本或数字值,并且可以使用 $feature 访问要素的属性,或者使用 $layer、$map 和 $datastore 访问来自其他要素和图层的数据。
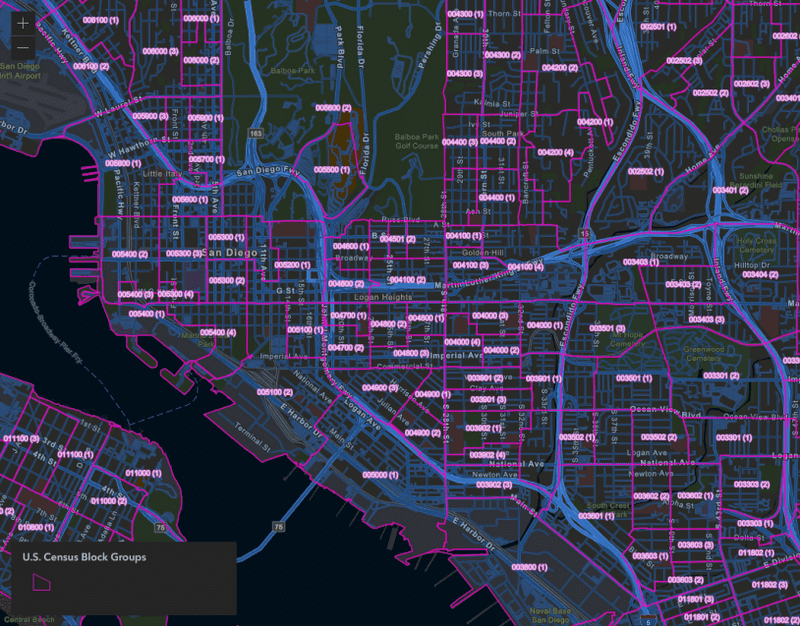
例如,在 PopupTemplate 中引用 Arcade 表达式 示例显示了一个包含每个美国县的劳动力统计数据的图层。一些属性包括失业率、人口和参与劳动力的人数。它没有劳动力参与率属性。我们可以在运行时使用 Arcade 来计算。
1
2
// 劳动力参与率
Round(($feature.CIVLBFR_CY / $feature.POP_16UP)* 100 , 2 )
从此表达式返回的值可以显示在图层的 popupTemplate 中。要查看弹出窗口中的值,必须在 PopupTemplate 的 expressionInfos 属性中引用它并为其指定 name 和 title。
1
2
3
4
5
6
7
8
9
layer.popupTemplate = {
expressionInfos : [{
name : "participation-rate" ,
title : "% of population 16+ participating in the labor force" ,
expression : "Round(($feature.CIVLBFR_CY / $feature.POP_16UP)*100,2)"
}],
content : "In {NAME} county, {expression/participation-rate}% of the population"
+ " participates in the labor force."
};
请注意,一旦表达式存在于 expressionInfos 属性中,即可在 PopupTemplate 的内容中使用 {expression/expression-name} 占位符模板引用从表达式返回的值。用户单击表示亚利桑那州格林利的要素后,弹出窗口的内容将显示以下内容:
您还可在弹出内容元素中引用 Arcade 表达式返回的值,包括 FieldsContent 、MediaContent 和 TextContent 。只需在对象的 fieldName 属性中引用表达式的名称即可。请记住使用 expression/expression-name 语法。
1
2
3
4
5
6
7
8
9
10
11
12
13
14
15
16
17
18
19
20
21
22
23
24
25
26
27
layer.popupTemplate = {
expressionInfos : [{
name : "participation-rate" ,
title : "% of population 16+ participating in the labor force" ,
expression : "Round(($feature.CIVLBFR_CY / $feature.POP_16UP)*100,2)"
}],
content : [{
type : "fields" ,
fieldInfos : [{
fieldName : "expression/participation-rate"
}, {
fieldName : "CIVLBFR_CY" ,
label : "Civilian labor force" ,
format : {
places : 0 ,
digitSeparator : true
}
}, {
fieldName : "POP_16UP" ,
label : "Population 16+" ,
format : {
places : 0 ,
digitSeparator : true
}
}]
}]
};
弹出窗口将显示以下内容:
查看在 PopupTemplate 中引用 Arcade 表达式 示例,以在实时示例的上下文中查看此工作流。
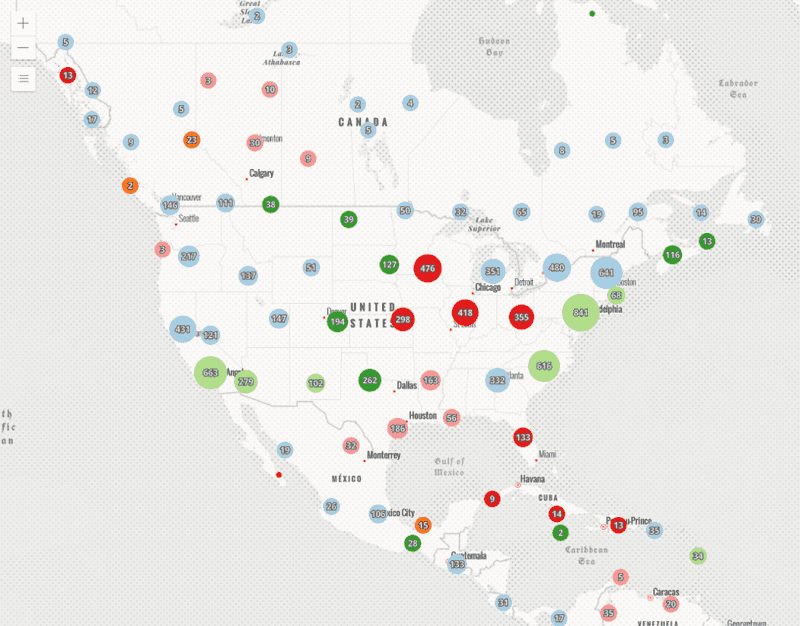
除了图层弹出窗口外,Arcade 表达式还可以在聚类 popupTemplate 的 content 中引用。这与图层弹出窗口略有不同,因为 $feature 表示聚类本身,它汇总了两个或多个要素。
除了汇总图层渲染器的其他字段(例如 cluster_avg_fieldName)之外,$feature 始终包含 cluster_count 字段。
1
2
// 返回聚类中所有要素的成本字段的总和
$feature .cluster_count * $feature .cluster_avg_cost
此配置文件还允许您通过 $aggregatedFeatures 全局访问聚类中包含的要素。可以过滤已聚合要素,对其进行遍历、排序,并用它们计算统计数据。
1
2
3
4
// 返回车祸总数
// 在代表机动车事故的聚类中
// 导致至少一人死亡
Count ( Filter ( $aggregated Features, "FATALITIES > 0" ))
这些表达式返回的值可以显示在聚类的 popupTemplate 中。要查看弹出窗口中的值,您必须在 PopupTemplate 的 expressionInfos 属性中引用它并为其指定 name 和 title。
1
2
3
4
5
6
7
8
9
10
11
12
13
14
15
16
17
18
19
20
21
layer.featureReduction = {
type : "cluster" ,
popupTemplate : {
expressionInfos : [{
name : "total-cost" ,
title : "Total damages" ,
expression : "Text($feature.cluster_count * $feature.cluster_avg_cost, '$#,###.##')"
}, {
name : "fatalities" ,
title : "Crashes with fatalities" ,
expression : `
Expects($aggregatedFeatures, 'FATALITIES')
Count(Filter($aggregatedFeatures, 'FATALITIES > 0'))
`
}],
content : `
This cluster represents {cluster_count} motor vehical accidents. {expression/fatalities} of these crashes
had at least one fatality. These crashes resulted in {expression/total-cost} of damages.
`
}
};
请注意,一旦表达式存在于 expressionInfos 属性中,即可使用 PopupTemplate 内容中的 {expression/expression-name} 字符串模板引用从表达式返回的值。
查看点聚类 - 过滤弹出要素 示例以查看此配置文件的实际应用。
弹出元素配置文件允许地图作者编写返回字典(即对象)的表达式,该字典表示富文本 、字段 或媒体 (即图表)弹出内容元素。返回的字典必须遵循 popupElement 的 Web 地图规范 。与 Popup 配置文件不同,此配置文件允许弹出窗口作者在单个元素中返回多个值。
在此配置文件中,表达式必须返回一个字典,并且可以使用 $feature 访问要素的属性,或者使用 $layer、$map 和 $datastore 访问来自其他要素和图层的数据。
在图表、表格或富文本元素中的内容基于逻辑条件的高级方案中,此配置文件很有用。例如,以下表达式创建一个字段内容元素,其中仅包含具有数据值的字段。这可能比标准的 FieldsContent 元素更简洁,后者无法检查字段是否为空。
1
2
3
4
5
6
7
8
9
10
11
12
13
14
15
16
17
18
19
20
21
22
23
24
25
26
27
// 创建仅具有包含数据的字段的表
var fields = Schema( $feature ).fields;
function getNames ( field ) {
return field.name;
}
function filterValidFields ( fieldName ) {
var invalidNames = [ "objectid" , "fid" , "shape__area" , "shape__length" ];
return !includes(invalidNames, lower(fieldName)) && ! IsEmpty ( $feature [fieldName]) && ! IsNan ( $feature [fieldName]);
}
var validFields = Filter (Map(fields, getNames), filterValidFields);
var attributes = {};
var fieldInfos = [];
for ( var f in validFields){
var fieldName = validFields[f];
Push(fieldInfos, { fieldName : fieldName });
// 使用数字分隔符和一位小数格式化数字
var value = IIF( TypeOf ( $feature [fieldName] == "Number" ), Text ( $feature [fieldName], "#,#.#" ), $feature [fieldName]);
attributes[fieldName] = value;
}
return {
type : "fields" ,
fieldInfos : fieldInfos,
attributes : attributes
};
弹出元素表达式在 ExpressionContent 元素的 expressionInfo 属性中定义。
1
2
3
4
5
6
7
8
9
10
11
12
13
14
15
16
17
18
19
20
21
22
23
24
25
26
27
28
29
30
31
32
33
34
35
36
37
38
39
40
41
42
43
44
// 创建一个柱形图,其中每个类别/值
// 是两个或多个字段的聚合
layer.popupTemplate = {
title : "Educational Attainment" ,
content : [{
type : "expression" ,
expressionInfo : {
expression : `
// Create a dictionary of attributes representing the values
// to display in the chart
var attributes = {
"No School": $feature.no_school + $feature.some_primary,
"Primary": $feature.primary_complete + $feature.some_secondary,
"Secondary": $feature.secondary_complete + $feature.some_highSchool,
"High School": $feature.highSchool_diploma + $feature.highSchool_ged + $feature.some_college,
"College/University": $feature.associates + $feature.bachelors + $feature.masters + $feature.doctorate + $feature.professional;
};
var fields = [];
// Create an array representing the attribute names (or keys)
for (var k in attributes){
Push(fields, k);
}
// Returns a dictionary providing the information
// required by the popup to render a column chart
return {
type: "media",
attributes: attributes,
title: "Educational attainment",
mediaInfos: [{
type: "columnchart",
value: {
// The list of attribute names (keys) to include in the chart
fields: fields
}
}]
};
` ,
title : "Educational Attainment"
}
}]
};
您还可以使用此元素创建由聚合数据值组成的图表或其他内容类型。这在 FeatureReductionCluster 弹出窗口中特别有用。以下示例描述了您可以在 Arcade 表达式中定义的各种内容类型。
HTML 列表 此示例演示了如何在弹出窗口中将有序值列表显示为富文本元素,其中所有值都派生自 Arcade 表达式。若要创建有序列表,请在 Arcade 表达式中执行以下操作:
使用 GroupBy 查询聚类中每种燃料类型的计数。 按类型总数对其进行排序。 迭代这些类型,并生成一个有序的 HTML 列表,其中显示具有元素数的类型。 将列表返回为 popupElement 规范定义的富文本元素。 全球发电厂。单击某个聚类可查看用于在该聚类内发电的所有燃料类型的列表。燃料类型显示为按计数排序的列表。
Show more lines
103
103
103
103
103
103
103
103
103
103
103
103
103
103
103
103
103
103
103
103
103
103
103
103
103
103
103
103
103
103
103
103
103
103
103
103
103
103
103
103
103
103
103
103
103
103
103
103
103
103
103
103
103
103
103
103
103
103
103
103
103
103
103
103
103
103
103
103
103
103
103
103
103
103
103
103
103
103
103
103
103
103
103
103
103
103
103
103
103
103
103
103
103
103
103
103
103
103
103
103
103
103
103
104
105
106
107
108
109
110
111
112
113
114
115
116
117
118
119
120
121
122
123
124
125
126
127
128
129
130
131
132
133
134
135
136
137
138
139
140
140
140
140
140
140
140
140
140
140
140
140
140
140
140
140
140
140
140
140
140
140
140
140
140
140
1
2
3
4
5
6
7
8
9
10
11
12
13
14
15
16
17
18
19
20
21
22
23
24
25
26
27
28
29
30
31
32
33
34
35
36
37
38
39
40
41
42
43
44
45
46
47
48
49
50
51
52
53
54
55
56
57
58
59
60
61
62
63
64
65
66
67
68
69
70
71
72
73
74
75
76
77
78
79
80
81
82
83
84
85
86
87
88
89
90
91
92
93
94
95
96
97
98
99
100
101
102
103
104
105
106
107
108
109
110
111
112
113
114
115
116
117
118
119
120
121
122
123
124
125
126
127
128
129
130
131
132
133
134
135
136
137
138
139
140
141
142
143
144
145
146
147
148
149
150
151
152
153
154
155
156
157
158
159
160
161
162
163
164
165
< html >
< head >
< meta charset = "utf-8" />
< meta name = "viewport" content = "initial-scale=1,maximum-scale=1,user-scalable=no" />
< title > Arcade Popup Element - HTML List </ title >
< link rel = "stylesheet" href = "https://js.geoscene.cn/4.23/geoscene/themes/light/main.css" />
< script src = "https://js.geoscene.cn/4.23/" > </ script >
< style >
html ,
body ,
#viewDiv {
height : 100% ;
width : 100% ;
margin : 0 ;
padding : 0 ;
}
</ style >
< script >
require ([
"geoscene/WebMap" ,
"geoscene/views/MapView" ,
"geoscene/layers/FeatureLayer" ,
"geoscene/widgets/Legend" ,
"geoscene/widgets/Expand" ,
"geoscene/smartMapping/labels/clusters"
], function (
WebMap,
MapView,
FeatureLayer,
Legend,
Expand,
clusterLabelCreator
) {
const layer = new FeatureLayer({
portalItem : {
id : "eb54b44c65b846cca12914b87b315169"
}
});
const map = new WebMap({
basemap : {
portalItem : {
id : "75a08e8cd8b64dcfa6945bb7f624ccc5"
}
},
layers : [layer]
});
const view = new MapView({
container : "viewDiv" ,
map,
extent : {
spatialReference : {
latestWkid : 3857 ,
wkid : 102100
},
xmin : - 15327459 ,
ymin : 2740044 ,
xmax : - 6076744 ,
ymax : 6878650
},
popup : {
dockEnabled : true ,
dockOptions : {
breakpoint : false ,
position : "top-right"
}
}
});
view.ui.add(
new Expand({
content : new Legend({ view }),
view
}),
"top-left"
);
layer
.when()
.then(generateClusterConfig)
.then( async (featureReduction) => {
// sets generated cluster configuration on the layer
layer.featureReduction = featureReduction;
// Disable clustering when user zooms beyond a 1:50,000 scale level
// Re-enable clustering when the user zooms out to a scale smaller than 1:50,000
view.watch( "scale" , function ( scale ) {
layer.featureReduction =
view.scale > 50000 ? featureReduction : null ;
});
})
.catch( ( error ) => {
console .error(error);
});
async function generateClusterConfig ( layer ) {
let popupTemplate = {
title : "Power plant summary" ,
content : [{
type : "text" ,
text : "The following list describes the number of power plants used to generate power for each fuel type in this cluster."
}, {
type : "expression" ,
expressionInfo : {
expression : `
Expects($aggregatedFeatures, "fuel1")
var statsFS = GroupBy($aggregatedFeatures,
[
{ name: 'Type', expression: 'fuel1'},
],
[ // statistics to return for each fuel type
{ name: 'num_features', expression: '1', statistic: 'COUNT' }
]
);
var ordered = OrderBy(statsFs, 'num_features DESC');
var list = "<ol>";
for (var group in ordered){
list += \`<li>\${group.Type} (\${Text(group.num_features, "#,###")})</li>\`
}
list += "</ol>";
return {
type: "text",
text: list
}
` ,
title : "Total Capacity List"
}
}]
};
// generates default labelingInfo
const { labelingInfo, clusterMinSize } = await clusterLabelCreator
.getLabelSchemes({
layer,
view
})
.then( ( labelSchemes ) => labelSchemes.primaryScheme);
return {
type : "cluster" ,
popupTemplate,
labelingInfo,
clusterMinSize
};
}
});
</ script >
</ head >
< body >
< div id = "viewDiv" > </ div >
</ body >
</ html >
Show more lines
字段表 此示例演示了如何将有序值列表显示为字段弹出元素,其中所有值都派生自 Arcade 表达式。要创建字段元素,请在Arcade 表达式中执行以下操作:
创建一个空 fieldsInfos 数组和一个空 attributes 字典。attributes 字典将包含要在弹出窗口中显示的计算值。 使用 GroupBy 对聚类内每种燃料类型的功率容量求和。 按类型的总容量对类型进行排序。 迭代这些类型,将每个类型添加为一个属性,并将其总容量设置为属性的值。 将类型推送到 fieldsInfos 数组。 将列表返回为 popupElement 规范定义的字段内容元素。 全球发电厂。单击某个聚类可查看用于在该聚类内发电的所有类型的燃料表。燃料类型按其总 mW 容量的顺序显示。
Show more lines
102
102
102
102
102
102
102
102
102
102
102
102
102
102
102
102
102
102
102
102
102
102
102
102
102
102
102
102
102
102
102
102
102
102
102
102
102
102
102
102
102
102
102
102
102
102
102
102
102
102
102
102
102
102
102
102
102
102
102
102
102
102
102
102
102
102
102
102
102
102
102
102
102
102
102
102
102
102
102
102
102
102
102
102
102
102
102
102
102
102
102
102
102
102
102
102
102
102
102
102
102
102
103
104
105
106
107
108
109
110
111
112
113
114
115
116
117
118
119
120
121
122
123
124
125
126
127
128
129
130
131
132
133
134
135
136
137
138
139
140
141
142
143
143
143
143
143
143
143
143
143
143
143
143
143
143
143
143
143
143
143
143
143
143
143
143
143
143
1
2
3
4
5
6
7
8
9
10
11
12
13
14
15
16
17
18
19
20
21
22
23
24
25
26
27
28
29
30
31
32
33
34
35
36
37
38
39
40
41
42
43
44
45
46
47
48
49
50
51
52
53
54
55
56
57
58
59
60
61
62
63
64
65
66
67
68
69
70
71
72
73
74
75
76
77
78
79
80
81
82
83
84
85
86
87
88
89
90
91
92
93
94
95
96
97
98
99
100
101
102
103
104
105
106
107
108
109
110
111
112
113
114
115
116
117
118
119
120
121
122
123
124
125
126
127
128
129
130
131
132
133
134
135
136
137
138
139
140
141
142
143
144
145
146
147
148
149
150
151
152
153
154
155
156
157
158
159
160
161
162
163
164
165
166
167
168
< html >
< head >
< meta charset = "utf-8" />
< meta name = "viewport" content = "initial-scale=1,maximum-scale=1,user-scalable=no" />
< title > Arcade Popup Element - fields </ title >
< link rel = "stylesheet" href = "https://js.geoscene.cn/4.23/geoscene/themes/light/main.css" />
< script src = "https://js.geoscene.cn/4.23/" > </ script >
< style >
html ,
body ,
#viewDiv {
height : 100% ;
width : 100% ;
margin : 0 ;
padding : 0 ;
}
</ style >
< script >
require ([
"geoscene/WebMap" ,
"geoscene/views/MapView" ,
"geoscene/layers/FeatureLayer" ,
"geoscene/widgets/Legend" ,
"geoscene/widgets/Expand" ,
"geoscene/smartMapping/labels/clusters"
], function (
WebMap,
MapView,
FeatureLayer,
Legend,
Expand,
clusterLabelCreator
) {
const layer = new FeatureLayer({
portalItem : {
id : "eb54b44c65b846cca12914b87b315169"
}
});
const map = new WebMap({
basemap : {
portalItem : {
id : "75a08e8cd8b64dcfa6945bb7f624ccc5"
}
},
layers : [layer]
});
const view = new MapView({
container : "viewDiv" ,
map,
extent : {
spatialReference : {
latestWkid : 3857 ,
wkid : 102100
},
xmin : - 15327459 ,
ymin : 2740044 ,
xmax : - 6076744 ,
ymax : 6878650
},
popup : {
dockEnabled : true ,
dockOptions : {
breakpoint : false ,
position : "top-right"
}
}
});
view.ui.add(
new Expand({
content : new Legend({ view }),
view
}),
"top-left"
);
layer
.when()
.then(generateClusterConfig)
.then( async (featureReduction) => {
// sets generated cluster configuration on the layer
layer.featureReduction = featureReduction;
// Disable clustering when user zooms beyond a 1:50,000 scale level
// Re-enable clustering when the user zooms out to a scale smaller than 1:50,000
view.watch( "scale" , function ( scale ) {
layer.featureReduction =
view.scale > 50000 ? featureReduction : null ;
});
})
.catch( ( error ) => {
console .error(error);
});
async function generateClusterConfig ( layer ) {
let popupTemplate = {
title : "Power plant summary" ,
content : [{
type : "text" ,
text : "The following table describes the total megawatt capacity of power plants used to generate power for each fuel type in this cluster."
}, {
type : "expression" ,
expressionInfo : {
expression : `
Expects($aggregatedFeatures, "fuel1", "capacity_mw")
var attributes = {};
var fieldInfos = [];
var statsFS = GroupBy($aggregatedFeatures,
[
{ name: 'Type', expression: 'fuel1'},
],
[ // statistics to return for each unique category
{ name: 'capacity_total', expression: 'capacity_mw', statistic: 'SUM' }
]
);
var ordered = OrderBy(statsFs, 'capacity_total DESC');
for(var f in ordered){
var type = f.Type;
attributes[type] = Text(f.capacity_total, "#,### mW");
Push(fieldInfos, {
fieldName: type
});
}
return {
type: "fields",
attributes: attributes,
fieldInfos: fieldInfos,
}
` ,
title : "Table of fuel types"
}
}]
};
// generates default labelingInfo
const { labelingInfo, clusterMinSize } = await clusterLabelCreator
.getLabelSchemes({
layer,
view
})
.then( ( labelSchemes ) => labelSchemes.primaryScheme);
return {
type : "cluster" ,
popupTemplate,
labelingInfo,
clusterMinSize
};
}
});
</ script >
</ head >
< body >
< div id = "viewDiv" > </ div >
</ body >
</ html >
Show more lines
饼形图 此示例演示了如何将饼图创建为媒体弹出窗口元素,其中饼图的所有值都派生自 Arcade 表达式。要创建图表,请在 Arcade 表达式中执行以下操作:
创建一个空 fieldNames 数组和一个空 attributes 字典。attributes 字典将包含图表中每个部分的值。 使用 Distinct 查找聚类中的每种燃料类型。 迭代这些类型,并将每个类型添加为一个属性,将其总数设置为属性的值。 将类型推送到 fieldNames 数组。 返回定义 popupElement 规范定义的媒体内容元素的字典。此元素必须包含属性和包含要包含在图表的 fieldNames 数组的 piechart mediaInfo 对象。 全球发电厂。单击聚类以查看饼图,该饼图可视化聚类中每种燃料类型的发电厂数量。
Show more lines
103
103
103
103
103
103
103
103
103
103
103
103
103
103
103
103
103
103
103
103
103
103
103
103
103
103
103
103
103
103
103
103
103
103
103
103
103
103
103
103
103
103
103
103
103
103
103
103
103
103
103
103
103
103
103
103
103
103
103
103
103
103
103
103
103
103
103
103
103
103
103
103
103
103
103
103
103
103
103
103
103
103
103
103
103
103
103
103
103
103
103
103
103
103
103
103
103
103
103
103
103
103
103
104
105
106
107
108
109
110
111
112
113
114
115
116
117
118
119
120
121
122
123
124
125
126
127
128
129
130
131
132
133
134
135
136
137
137
137
137
137
137
137
137
137
137
137
137
137
137
137
137
137
137
137
137
137
137
137
137
137
137
1
2
3
4
5
6
7
8
9
10
11
12
13
14
15
16
17
18
19
20
21
22
23
24
25
26
27
28
29
30
31
32
33
34
35
36
37
38
39
40
41
42
43
44
45
46
47
48
49
50
51
52
53
54
55
56
57
58
59
60
61
62
63
64
65
66
67
68
69
70
71
72
73
74
75
76
77
78
79
80
81
82
83
84
85
86
87
88
89
90
91
92
93
94
95
96
97
98
99
100
101
102
103
104
105
106
107
108
109
110
111
112
113
114
115
116
117
118
119
120
121
122
123
124
125
126
127
128
129
130
131
132
133
134
135
136
137
138
139
140
141
142
143
144
145
146
147
148
149
150
151
152
153
154
155
156
157
158
159
160
161
162
< html >
< head >
< meta charset = "utf-8" />
< meta name = "viewport" content = "initial-scale=1,maximum-scale=1,user-scalable=no" />
< title > Arcade Popup Element - Pie Chart </ title >
< link rel = "stylesheet" href = "https://js.geoscene.cn/4.23/geoscene/themes/light/main.css" />
< script src = "https://js.geoscene.cn/4.23/" > </ script >
< style >
html ,
body ,
#viewDiv {
height : 100% ;
width : 100% ;
margin : 0 ;
padding : 0 ;
}
</ style >
< script >
require ([
"geoscene/WebMap" ,
"geoscene/views/MapView" ,
"geoscene/layers/FeatureLayer" ,
"geoscene/widgets/Legend" ,
"geoscene/widgets/Expand" ,
"geoscene/smartMapping/labels/clusters"
], function (
WebMap,
MapView,
FeatureLayer,
Legend,
Expand,
clusterLabelCreator
) {
const layer = new FeatureLayer({
portalItem : {
id : "eb54b44c65b846cca12914b87b315169"
}
});
const map = new WebMap({
basemap : {
portalItem : {
id : "75a08e8cd8b64dcfa6945bb7f624ccc5"
}
},
layers : [layer]
});
const view = new MapView({
container : "viewDiv" ,
map,
extent : {
spatialReference : {
latestWkid : 3857 ,
wkid : 102100
},
xmin : - 15327459 ,
ymin : 2740044 ,
xmax : - 6076744 ,
ymax : 6878650
},
popup : {
dockEnabled : true ,
dockOptions : {
breakpoint : false ,
position : "top-right"
}
}
});
view.ui.add(
new Expand({
content : new Legend({ view }),
view
}),
"top-left"
);
layer
.when()
.then(generateClusterConfig)
.then( async (featureReduction) => {
// sets generated cluster configuration on the layer
layer.featureReduction = featureReduction;
// Disable clustering when user zooms beyond a 1:50,000 scale level
// Re-enable clustering when the user zooms out to a scale smaller than 1:50,000
view.watch( "scale" , function ( scale ) {
layer.featureReduction =
view.scale > 50000 ? featureReduction : null ;
});
})
.catch( ( error ) => {
console .error(error);
});
async function generateClusterConfig ( layer ) {
let popupTemplate = {
title : "Power plant summary" ,
content : [{
type : "expression" ,
expressionInfo : {
expression : `
Expects($aggregatedFeatures, "fuel1")
var attributes = {};
var fieldNames = [];
var types = Distinct($aggregatedFeatures, "fuel1");
for(var t in types){
var type = t.fuel1;
Push(fieldNames, type);
attributes[type] = Count(Filter($aggregatedFeatures, "fuel1 = @type" ));
}
return {
type: "media",
attributes: attributes,
title: "Total power plants",
mediaInfos: [{
type: "piechart",
value: {
fields: fieldNames
}
}]
}
` ,
title : "Total Power Plants Pie Chart"
}
}]
};
// generates default labelingInfo
const { labelingInfo, clusterMinSize } = await clusterLabelCreator
.getLabelSchemes({
layer,
view
})
.then( ( labelSchemes ) => labelSchemes.primaryScheme);
return {
type : "cluster" ,
popupTemplate,
labelingInfo,
clusterMinSize
};
}
});
</ script >
</ head >
< body >
< div id = "viewDiv" > </ div >
</ body >
</ html >
Show more lines
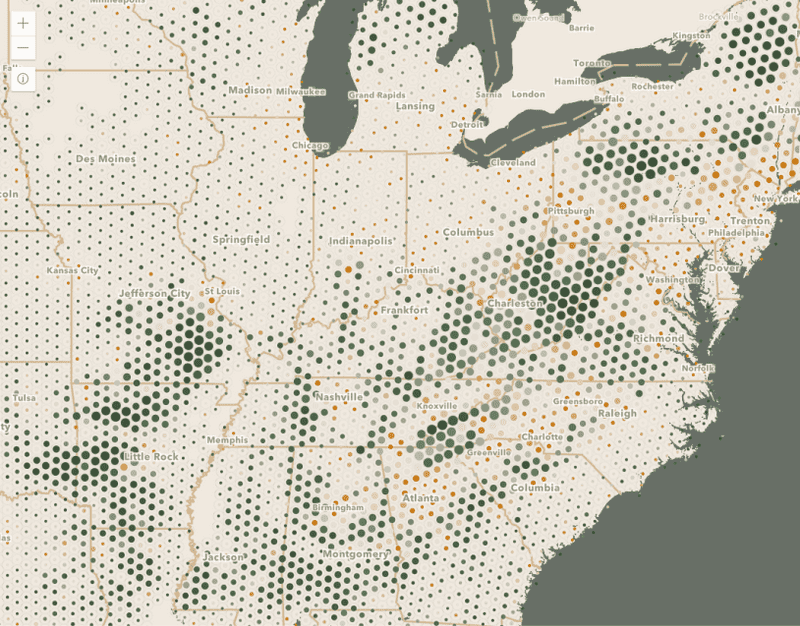
在可视化配置文件 中,Arcade 允许您在运行时计算图层中每个要素的值,并将这些值用于数据驱动的可视化。这是基于图层中的单个字段创建数据驱动型可视化的另一种方法。为此,可以将 Arcade 表达式传递给 ClassBreaksRenderer 、UniqueValueRenderer 或任何视觉变量中的 valueExpression 属性:颜色 、大小 、不透明度 和旋转 ,而不是引用 field/normalizationField。您还可以使用 Arcade 在符号的 primitiveOverrides 的 valueExpressionInfo.expression 属性中覆盖 CIMSymbol 的属性。
当在 ClassBreaksRenderer 或任何视觉变量中使用时,表达式可以使用 $feature 访问要素的属性,并且必须计算为数字。表达式可以计算为 UniqueValueRenderer 中的字符串或数字。
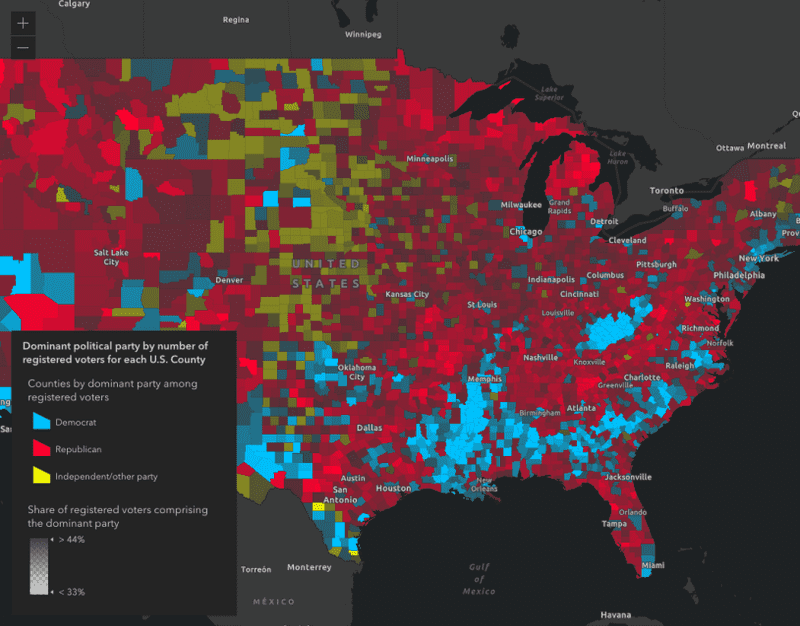
在以下代码段中,将代表美国县的 FeatureLayer 添加到地图中。 该服务包含三个字段,用于确定每个县的共和党人、民主党人和独立/非党派选民的数量。 我们可以编写一个 Arcade 表达式,根据哪个政党偏好多于其他政党来为每个县着色。
首先,将 Arcade 表达式写入具有唯一 ID 的脚本标记中。
1
2
3
4
5
6
7
8
9
10
11
12
13
14
15
16
17
18
19
< script type = "text/plain" id = "winning-party" >
// 编写表达式并
// 在表达式中使用有意义的变量名引用
//每个字段的值。然后使用
// Max() 函数计算最大数,
// 并使用 Decode() 返回一个字符串值,
//表示其字段值与最大值匹配的一方。
var republican = $feature.MP06025a_B;
var democrat = $feature.MP06024a_B;
var independent = $feature.MP06026a_B;
var parties = [republican, democrat, independent];
// Decode() 和 Max() 是 Arcade 的内置函数
return Decode( Max(parties),
republican, 'republican' ,
democrat, 'democrat' ,
independent, 'independent' ,
'n/a' );
</ script >
然后在 UniqueValueRenderer 的 valueExpression 属性上使用 document.getElementById() 将表达式设置为字符串值。
1
2
3
4
5
6
7
8
9
10
11
12
13
14
15
16
17
18
19
20
21
22
23
// 将表达式分配给 `valueExpression` 属性,
// 并根据您在表达式中设置的解码值
// 设置唯一值信息。
const winnerArcade = document .getElementById( "winning-party" ).text;
const renderer = new UniqueValueRenderer({
valueExpression : winnerArcade,
valueExpressionTitle : "Counties by dominant party among registered voters" ,
uniqueValueInfos : [{
value : "democrat" ,
symbol : createSymbol( "#00c3ff" ),
label : "Democrat"
}, {
value : "republican" ,
symbol : createSymbol( "#ff002e" ),
label : "Republican"
}, {
value : "independent" ,
symbol : createSymbol( "#faff00" ),
label : "Independent/non-affiliated"
}]
});
您还可以在渲染器中添加一个不透明度视觉变量,以可视化每个县的主要政党的相对强度。 来自单一政党的人较多的县将以高不透明度绘制,而来自各方人口比例相对相等的县将以低不透明度绘制。
首先,将表达式写在 <script> 标记中。
1
2
3
4
5
6
7
8
9
10
11
12
13
14
15
16
17
18
19
20
< script type = "text/plain" id = "strength" >
// 编写表达式并
// 在表达式中使用有意义的变量名引用每个字段的值。
// 然后使用 Max() 函数计算最大数,
// 使用 Sum() 计算总数。
// 计算县内最大人口的份额。
// 该值介于 33 - 100 之间,
// 用于确定要素的不透明度。
// 请注意,该值是显式返回的;它也可以
// 像前面的示例一样隐式返回
var republican = $feature.MP06025a_B;
var democrat = $feature.MP06024a_B;
var independent = $feature.MP06026a_B;
var parties = [republican, democrat, independent];
var total = Sum(parties);
var max = Max(parties);
return (max / total) * 100 ;
</ script >
然后在 JavaScript 中将其作为字符串值引用。
1
2
3
4
5
6
7
8
9
10
11
12
13
14
15
16
17
18
// 将表达式分配给 `valueExpression` 属性,
// 并根据您在表达式中设置的解码值
// 设置唯一值信息。
const strengthArcade = document .getElementById( "strength" ).text;
const opacityVV = {
type : "opacity" ,
valueExpression : strengthArcade,
stops : [
{ value : 33 , opacity : 0.1 },
{ value : 50 , opacity : 1.0 }
]
};
//将视觉变量添加到渲染器
renderer.visualVariables = [ opacityVV ];
查看使用 Arcade 创建自定义可视化 示例以实时查看此示例。
约束配置文件 在 FeatureForm 微件中实现,允许您在编辑工作流期间控制字段和分组字段的可见性。您可以使用 Arcade 表达式将某些字段配置为有条件地显示,而不是在各种字段配置中显示所有指定字段。可见性表达式允许您使用 $feature 访问要素的属性,并且必须返回 Boolean 值。
表达式是在 ExpressionInfo 对象的表达式 属性上设置的。ExpressionInfos 在 FormTemplate.expressionInfos 属性上设置。要有条件地设置表单元素的可见性,您必须在 Element 的 visibilityExpression 属性中引用表达式 name。
在下面的示例中,第二个字段配置显示一个标记为“问题状态”的字段。如果 status 的值为 Completed 且 resolution 字段有值,则将显示第三个字段 resolution。
1
2
3
4
5
6
7
8
9
10
11
12
13
14
15
16
17
18
19
20
21
22
23
24
25
const formTemplate = new FormTemplate({
title : "Inspector report" ,
description : "Enter all relevant information below" ,
elements : [
new FieldElement({
fieldName : "inspector" ,
label : "Inspector name"
}),
new FieldElement({
fieldName : "status" ,
label : "Issue status"
}),
new FieldElement({
fieldName : "resolution" ,
label : "Resolution" ,
// 下面定义的表达式
visibilityExpression : "resolutionVisible"
})
],
expressionInfos : [{
name : "resolutionVisible" ,
title : "Resolution if status is completed" ,
expression : "$feature.status == 'Completed' && !IsEmpty($feature.resolution)"
}]
});
在 2D MapViews 中,您可以使用 Arcade 表达式来确定要素应在视图中呈现的排序顺序。要素排序是在 FeatureLayer 的 orderBy 属性上配置的。用于排序要素绘制顺序的表达式必须遵循要素 Z 配置文件 规范。他们可以使用 $feature 引用属性,并且必须返回一个数字或日期值。
1
2
3
4
5
6
7
// 按风暴警告持续时间降序排列要素。
// 持续时间较长的警告将是
//在持续时间较短的警告之上呈现。
layer.orderBy = [{
valueExpression : "DateDiff($feature.Watch_End, $feature.Watch_Start, 'hours' )" ,
order : "descending"
}];
在 3D SceneViews 中,您可以使用 Arcade 表达式在要素上设置自定义 Z 值。尽管要素可以在其几何内部具有 Z 值,但您可能希望根据属性值计算或替换它们,或者使用 Z 值从公式中推导出它。 您可能还拥有在其几何中不包含 Z 值的要素,但在属性字段中存储了与 Z 相关的信息。在这些情况下,您可以在 featureExpressionInfo.expression 属性中设置表达式。覆盖 Z 值的表达式必须遵循要素 Z 配置文件 规范。他们可以使用 $feature 引用属性并且必须返回一个数字。例如,高程选项 示例显示了如何使用 Arcade 更改点的 Z 值:
1
2
3
4
5
6
7
layer.elevationInfo = {
mode : "absolute-height" ,
featureExpressionInfo : {
expression : "Geometry($feature).z + $feature.HEIGHT"
},
unit : "meters"
};
在以上示例中,将字段属性 HEIGHT 添加到几何的 Z 值以设置最终图形的高程。对于折线或面要素,每个要素的所有顶点都将使用从 expression 返回的相同 Z 值。