视觉变量
什么是视觉变量?
地图上能引起视觉变化的基本图形、色彩因素称为视觉变量。视觉变量是允许您根据从字段或表达式返回的数值数据值覆盖渲染符号的一个或多个属性的对象。这是使用分级渲染可视化数据的替代方法。与将值分离到离散数据范围中不同,视觉变量会在数据停靠点之间进行线性插值,以创建平滑、连续(未分类)的可视化效果。
有四个视觉变量可覆盖到数据值。
- 颜色
- 大小
- 不透明度
- 旋转
视觉变量的工作原理
所有视觉变量都将添加到渲染器的 visualVariables 属性中。渲染器可以包含多个视觉变量,但一次添加多个视觉变量可能会导致混淆。
多元可视化
了解如何在单一渲染中有效地使用多个视觉变量。
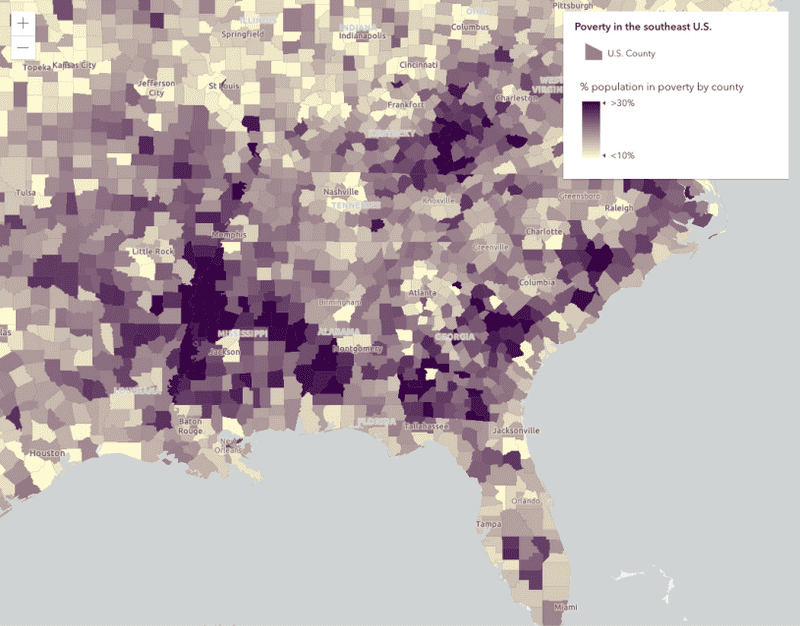
颜色
颜色变量基于从字段或表达式返回的数值,使用连续色带从而覆盖符号的颜色。使用颜色可视化数值数据之前,应对其进行归一化,特别是对于面图层。
颜色视觉变量需要满足以下条件:
- 指定字段名称或 Arcade 表达式。
- 至少两个色标(用于将数据值与颜色相匹配)。数据值位于指定色标之间的符号颜色是线性插值的。
以下示例采用连续色带渲染气象站报告的当前温度。
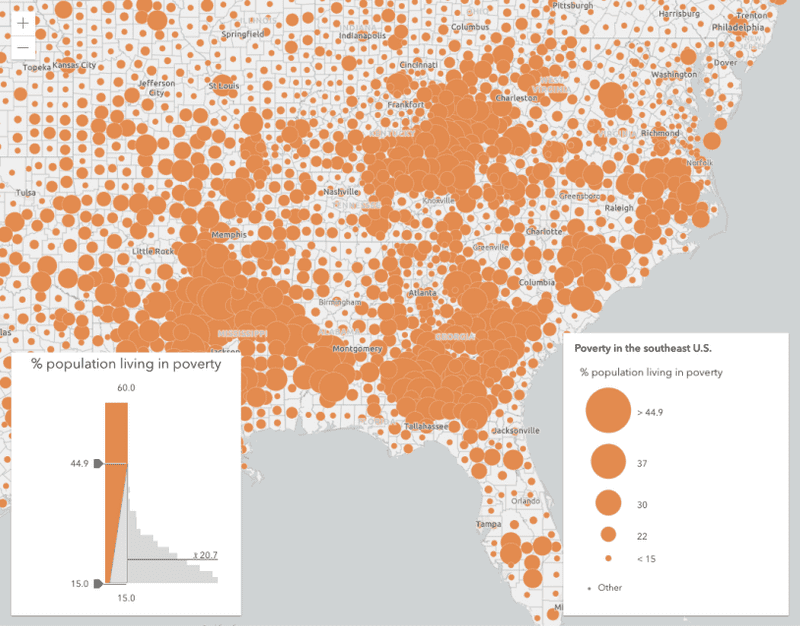
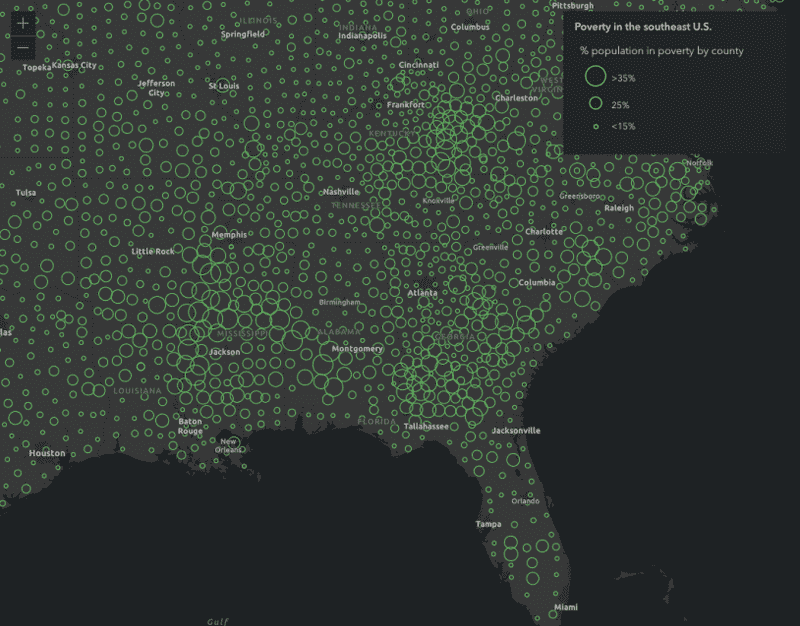
大小
大小变量基于从字段或表达式返回的数据值覆盖符号的大小。不适用于具有填充符号的渲染类型。要按大小可视化面图层,应使用标记符号,其将在面的质心处进行渲染。
可通过两种不同的方式定义大小视觉变量:
- 大小断点,或
- 将
maxDataValue与maxSize进行匹配;将minDataValue与minSize进行匹配。
大小视觉变量需要满足以下条件:
- 指定字段名称或 Arcade 表达式。
- 至少两个大小断点(将数据值与大小进行匹配)。数据值介于指定断点之间的符号大小是线性插值的。
以下示例使用连续大小符号渲染气象站报告的当前风速。
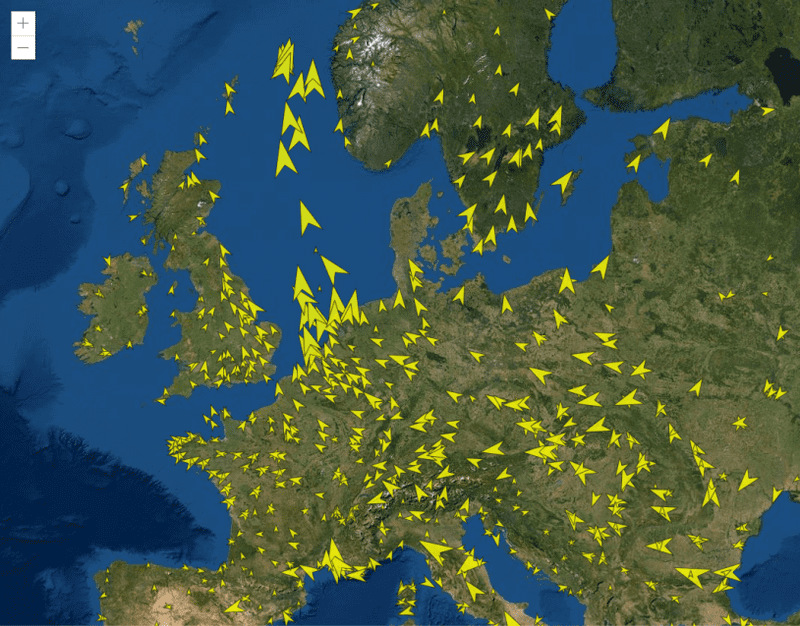
旋转
旋转变量可基于从字段或表达式返回的数值数据值设置符号的旋转。这通常用于旋转指示方向性的符号,例如:
- 风向
- 交通流量
- 坡向
旋转视觉变量与其他视觉变量的不同之处在于,它们仅需一个数据值,而不需要停止点。
- 指定字段名称或 Arcade 表达式。
- 设置可选旋转类型,几何旋转或变换旋转。
以下示例通过使用箭头标记气象站,并根据风向旋转它们来进行可视化。
透明度
透明度变量将基于从字段或表达式返回的数值型数据值覆盖符号的透明度。此变量通常用于展示某些要素比其他要素更突出。
透明度视觉变量需要满足以下条件:
- 指定字段名称或 Arcade 表达式。
- 至少两个透明度停靠点,用于将数据值与介于
0和1之间的透明度值相匹配。数据值在指定停靠点之间的符号的透明度是线性插值的。
以下示例可视化了主要作物情况。渲染类具有一个不透明度变量,可通过比较来强调拥有大量农田的地区,并淡化拥有很少农田的地区。
相关示例和资源

生成数据驱动型连续大小可视化
生成数据驱动型连续大小可视化


大小视觉变量主题
大小视觉变量主题

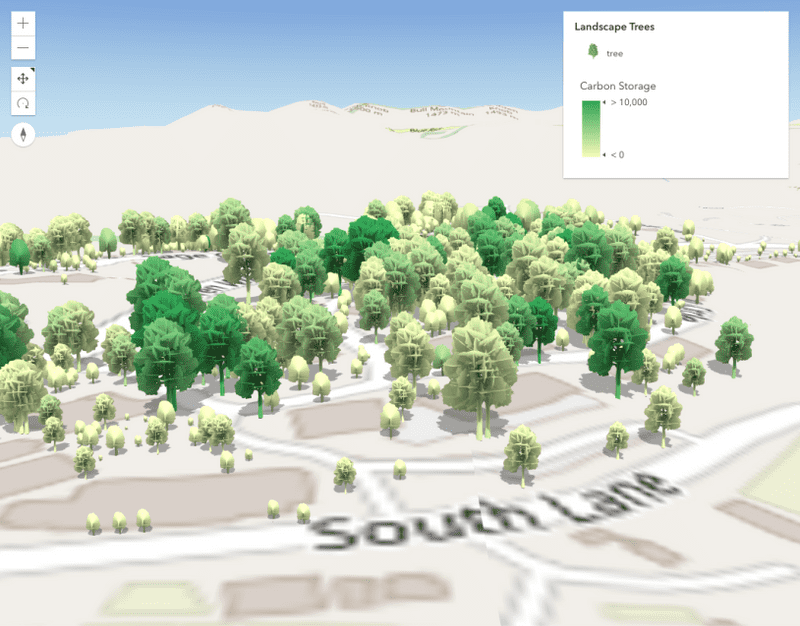
具有真实 3D 符号的主题可视化
具有真实 3D 符号的主题可视化

数据驱动的连续颜色
数据驱动的连续颜色

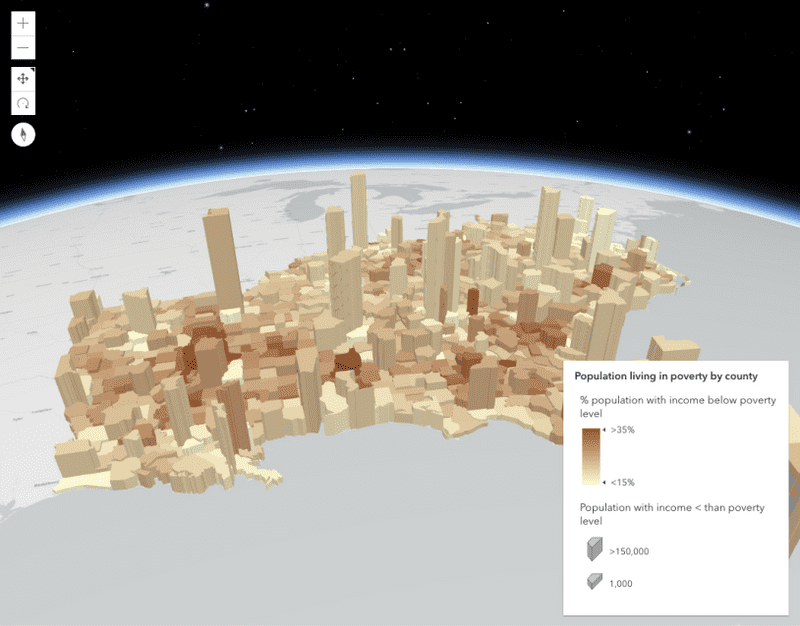
数据驱动型拉伸
数据驱动型拉伸


数据驱动型不透明度
数据驱动型不透明度

通过旋转可视化数据
通过旋转可视化数据

数据驱动型连续大小
数据驱动型连续大小