唯一值类型
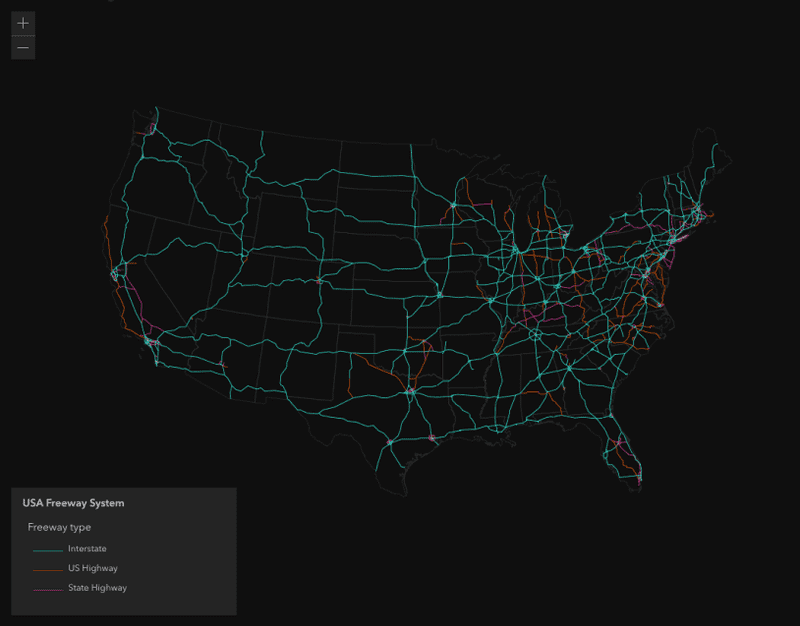
按高速公路类型进行唯一值渲染高速公路图层
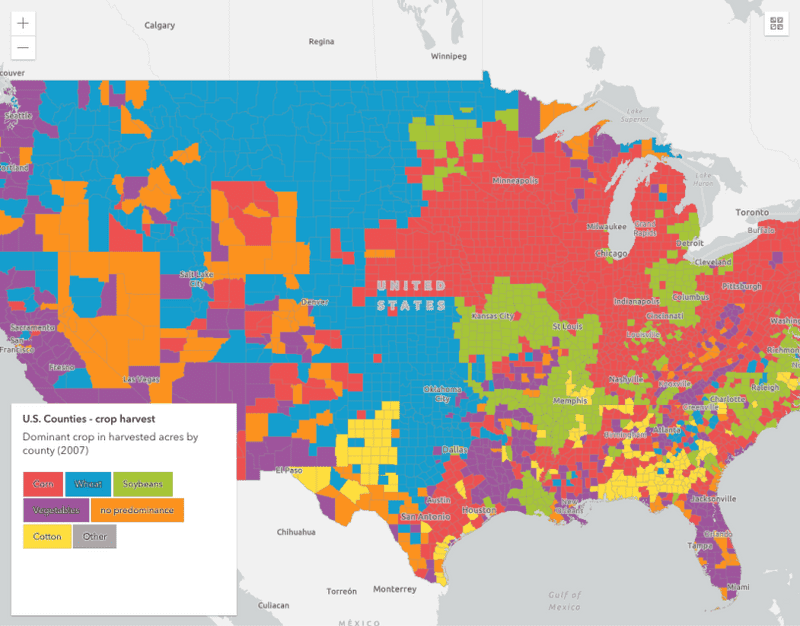
什么是唯一值类型样式?
唯一值类型样式可以基于要素中一个或多个属性字段进行绘制,它使用不同的符号表示由唯一属性值定义的各个类别,例如:
- 在地图上显示感兴趣点(例如学校、公园、礼拜地点)
- 表示类别(比如数据的区域、类型)
- 可视化排序数据(例如高、中、低)
唯一值样式的工作原理
此样式使用UniqueValueRenderer进行配置。此类渲染需要满足以下条件:
- 指定数据值,可以通过字段名称或 Arcade 表达式来指定。
- 唯一值字典列表,可用于将唯一值符号和从字段或表达式返回的预期值进行匹配。
示例
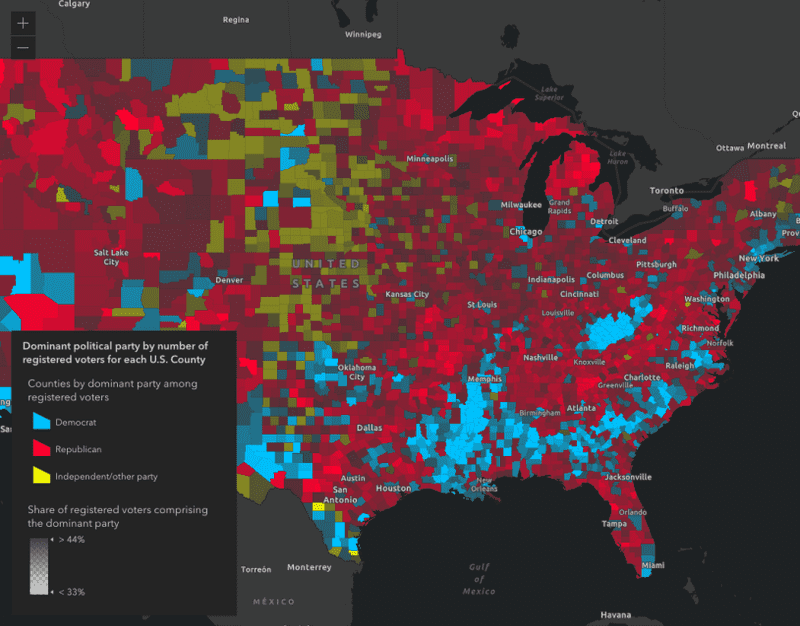
分类数据
此示例演示了如何使用属性值可视化类别。该应用程序根据高速公路类别对其进行可视化:分为公路、国道或高速公路。
- 创建唯一值渲染对象。
- 设置包含分类值的字段名称。
- 创建唯一值信息对象,并为每个预期值分配一个符号。
- 添加默认符号,没有匹配值的要素可以使用默认符号。
41
41
41
41
41
41
41
41
41
41
41
41
41
41
41
41
41
41
41
41
41
41
41
41
41
41
41
41
41
41
41
41
41
41
41
41
41
41
41
41
41
42
43
44
45
46
47
48
49
50
51
52
53
54
55
56
57
58
59
60
61
62
63
64
65
66
67
68
69
70
71
72
73
74
75
76
76
76
76
76
76
76
76
76
76
76
76
76
76
76
76
76
76
76
76
76
76
76
76
76
76
76
76
76
76
76
76
76
76
76
76
76
76
76
76
76
76
76
76
76
76
1
2
3
4
5
6
7
8
9
10
11
12
13
14
15
16
17
18
19
20
21
22
23
24
25
26
27
28
29
30
31
32
33
34
35
36
37
38
39
40
41
42
43
44
45
46
47
48
49
50
51
52
53
54
55
56
57
58
59
60
61
62
63
64
65
66
67
68
69
70
71
72
73
74
75
76
77
78
79
80
81
82
83
84
85
86
87
88
89
90
91
92
93
94
95
96
97
98
99
100
101
102
103
104
105
106
107
108
109
110
111
112
113
114
115
116
117
118
119
120
121
<!DOCTYPE html>
<html>
  <head>
    <meta charset="utf-8" />
    <meta
      name="viewport"
      content="initial-scale=1,maximum-scale=1,user-scalable=no"
    />
    <title>
      GeoScene Developer Guide: Unique types
    </title>

    <link
      rel="stylesheet"
      href="https://js.geoscene.cn/4.23/geoscene/themes/dark/main.css"
    />
    <script src="https://js.geoscene.cn/4.23/"></script>

    <style>
      html,
      body,
      #viewDiv {
        padding: 0;
        margin: 0;
        height: 100%;
        width: 100%;
        background-color: rgba(15, 15, 15, 1);
      }
    </style>

    <script>
      require([
        "geoscene/config",
        "geoscene/Map",
        "geoscene/views/MapView",
        "geoscene/layers/FeatureLayer",
        "geoscene/widgets/Legend"
      ], function (geosceneConfig,Map, MapView, FeatureLayer, Legend) {

        geosceneConfig.apiKey = "YOUR_API_KEY";

        const hwyRenderer = {
          type: "unique-value",
          legendOptions: {
            title: "Freeway type"
          },
          field: "CLASS",
          uniqueValueInfos: [{
            value: "S",
            label: "State highway",
            symbol: {
              type: "simple-line",
              color: "#e6d800",
              width: "6px",
              style: "solid"
            }
          }, {
            value: "I",
            label: "Interstate",
            symbol: {
              type: "simple-line",
              color: "#e60049",
              width: "6px",
              style: "solid"
            }
          }, {
            value: "U",
            label: "US Highway",
            symbol: {
              type: "simple-line",
              color: "#9b19f5",
              width: "6px",
              style: "solid"
            }
          }]
        };


        // Set the renderer on the layer
        const hwyLayer = new FeatureLayer({
          url:
            "https://services.arcgis.com/P3ePLMYs2RVChkJx/arcgis/rest/services/USA_Freeway_System/FeatureServer/2",
          renderer: hwyRenderer,
          title: "USA Freeway System",
          minScale: 0,
          maxScale: 0
        });

        // Add the layer to the map
        const map = new Map({
          basemap: {
            portalItem: {
              id: "56b5bd522c52409c90d902285732e9f1"
            }
          },
          layers: [hwyLayer]
        });

        const view = new MapView({
          container: "viewDiv",
          map: map,
          center: [-93.20, 44.917 ],
          scale: 577790.5542885,
          constraints: {
            snapToZoom:false
          }
        });

        const legend = new Legend({
          view: view
        });

        view.ui.add(legend, "bottom-right");
      });
    </script>
  </head>

  <body>
    <div id="viewDiv"></div>
  </body>
</html>兴趣点 (3D)
此示例演示了如何在 3D 场景中可视化兴趣点(POI)。该例子使用 PictureMarkerSymbol 创建 POI 符号。
- 创建唯一值渲染对象。
- 引用包含位置类型的字段名称 (例如,
museum、park等)。 - 创建唯一值信息对象,并为每个预期值分配一个符号。
96
96
96
96
96
96
96
96
96
96
96
96
96
96
96
96
96
96
96
96
96
96
96
96
96
96
96
96
96
96
96
96
96
96
96
96
96
96
96
96
96
96
96
96
96
96
96
96
96
96
96
96
96
96
96
96
96
96
96
96
96
96
96
96
96
96
96
96
96
96
96
96
96
96
96
96
96
96
96
96
96
96
96
96
96
96
96
96
96
96
96
96
96
96
96
96
97
98
99
100
101
102
103
104
105
106
107
108
109
110
111
112
113
114
115
116
117
118
119
120
121
122
123
124
124
124
124
124
124
124
124
124
124
124
124
124
124
124
124
124
124
124
124
124
124
124
124
124
124
124
124
124
124
124
124
124
124
124
124
124
124
124
124
124
124
124
124
124
124
124
124
124
124
124
124
124
124
124
124
124
124
124
124
124
124
124
1
2
3
4
5
6
7
8
9
10
11
12
13
14
15
16
17
18
19
20
21
22
23
24
25
26
27
28
29
30
31
32
33
34
35
36
37
38
39
40
41
42
43
44
45
46
47
48
49
50
51
52
53
54
55
56
57
58
59
60
61
62
63
64
65
66
67
68
69
70
71
72
73
74
75
76
77
78
79
80
81
82
83
84
85
86
87
88
89
90
91
92
93
94
95
96
97
98
99
100
101
102
103
104
105
106
107
108
109
110
111
112
113
114
115
116
117
118
119
120
121
122
123
124
125
126
127
128
129
130
131
132
133
134
135
136
137
138
139
140
141
142
143
144
145
146
147
148
149
150
151
152
153
154
155
156
157
158
159
160
161
162
163
164
165
166
167
168
169
170
171
172
173
174
175
176
177
178
179
180
181
182
183
184
185
186
<!DOCTYPE html>
<html>
  <head>
    <meta charset="utf-8" />
    <title>Points of interest</title>

    <link rel="stylesheet" href="https://js.geoscene.cn/4.23/geoscene/themes/light/main.css" />
    <script src="https://js.geoscene.cn/4.23/"></script>

    <style>
      html,
      body,
      #viewDiv {
        width: 100%;
        height: 100%;
        margin: 0;
        padding: 0;
      }
    </style>

    <script>
      require([
        "geoscene/WebScene",
        "geoscene/layers/FeatureLayer",
        "geoscene/views/SceneView",
        "geoscene/widgets/Legend",
        "geoscene/widgets/Expand"
      ], function(
        WebScene,
        FeatureLayer,
        SceneView,
        Legend,
        Expand
      ) {
        // Load the webscene with buildings

        const webscene = new WebScene({
          portalItem: {
            // autocasts as new PortalItem()
            id: "711ddecedece4fd88b728bfe4322c22b"
          }
        });

        const view = new SceneView({
          container: "viewDiv",
          map: webscene,
          environment: {
            lighting: {
              directShadowsEnabled: true,
              ambientOcclusionEnabled: true
            }
          }
        });

        // verticalOffset shifts the symbol vertically
        const verticalOffset = {
          screenLength: 40,
          maxWorldLength: 200,
          minWorldLength: 35
        };

        // Function that automatically creates the symbol for the points of interest
        function getUniqueValueSymbol(name, color) {
          // The point symbol is visualized with an icon symbol. To clearly see the location of the point
          // we displace the icon vertically and add a callout line. The line connects the offset symbol with the location
          // of the point feature.
          return {
            type: "point-3d",
            symbolLayers: [
              {
                type: "icon",
                resource: {
                  href: name
                },
                size: 20,
                outline: {
                  color: "white",
                  size: 2
                }
              }
            ],

            verticalOffset: verticalOffset,

            callout: {
              type: "line",
              color: "white",
              size: 2,
              border: {
                color: color
              }
            }
          };
        }


        // Expand the code above to view how each marker
        // symbol is created in getUniqueValueSymbol()
        const pointsRenderer = {
          type: "unique-value",
          field: "Type",
          uniqueValueInfos: [
            {
              value: "Museum",
              symbol: getUniqueValueSymbol("https://developers.geoscene.cn/javascript/latest/sample-code/visualization-point-styles/live/Museum.png", "#D13470")
            },
            {
              value: "Restaurant",
              symbol: getUniqueValueSymbol("https://developers.geoscene.cn/javascript/latest/sample-code/visualization-point-styles/live/Restaurant.png", "#F97C5A")
            },
            {
              value: "Church",
              symbol: getUniqueValueSymbol("https://developers.geoscene.cn/javascript/latest/sample-code/visualization-point-styles/live/Church.png", "#884614")
            },
            {
              value: "Hotel",
              symbol: getUniqueValueSymbol("https://developers.geoscene.cn/javascript/latest/sample-code/visualization-point-styles/live/Hotel.png", "#56B2D6")
            },
            {
              value: "Park",
              symbol: getUniqueValueSymbol("https://developers.geoscene.cn/javascript/latest/sample-code/visualization-point-styles/live/Park.png", "#40C2B4")
            }
          ]
        };


        // Create the layer with the points of interest
        // Initially points are aligned to the buildings with relative-to-scene,
        // feature reduction is set to "selection" to avoid overlapping icons.
        // A perspective view is enabled on the layers by default.
        const pointsLayer = new FeatureLayer({
          url: "http://services.arcgis.com/V6ZHFr6zdgNZuVG0/arcgis/rest/services/LyonPointsOfInterest/FeatureServer",
          title: "Touristic attractions",
          elevationInfo: {
            // elevation mode that will place points on top of the buildings or other SceneLayer 3D objects
            mode: "relative-to-scene"
          },
          renderer: pointsRenderer,
          outFields: ["*"],
          // feature reduction is set to selection because our scene contains too many points and they overlap
          featureReduction: {
            type: "selection"
          },
          labelingInfo: [
            {
              labelExpressionInfo: {
                value: "{Name}"
              },
              symbol: {
                type: "label-3d", // autocasts as new LabelSymbol3D()
                symbolLayers: [
                  {
                    type: "text", // autocasts as new TextSymbol3DLayer()
                    material: {
                      color: "white"
                    },
                    // we set a halo on the font to make the labels more visible with any kind of background
                    halo: {
                      size: 1,
                      color: [50, 50, 50]
                    },
                    size: 10
                  }
                ]
              }
            }
          ]
        });

        webscene.add(pointsLayer);

        const legend = new Legend({ view });

        view.ui.add(new Expand({
          view,
          content: legend,
          expanded: true
        }), "top-right");
      });
    </script>
  </head>

  <body>
    <div id="viewDiv" class="geoscene-widget"></div>
  </body>
</html>顺序数据
此示例演示了如何使用 Arcade 表达式从数值字段属性创建顺序类别。此应用程序按低、中或高卡车流量对高速公路进行分类。
- 创建唯一值渲染器。
- 编写 Arcade 表达式以将数据分类为顺序类别:低、中和高。然后在
valueExpression属性中引用它。请参阅以下代码。 - 创建唯一值信息对象,并为每个预期值分配一个符号。
- 您可选择性地添加默认符号来表示没有匹配值的所有要素。
分类数值数据的 Arcade 表达式
32
32
32
32
32
32
32
32
32
32
32
32
32
32
32
32
32
32
32
32
32
32
32
32
32
32
32
32
32
32
32
32
33
34
35
36
37
38
38
38
38
38
38
38
38
38
38
38
38
38
38
38
38
38
38
38
38
38
38
38
38
38
38
38
38
38
38
38
38
38
38
38
38
38
38
38
38
38
38
38
38
38
38
38
38
38
38
38
38
38
38
38
38
38
38
38
38
38
38
38
38
38
38
38
38
38
38
38
38
38
38
38
38
38
38
38
38
38
38
38
38
38
38
38
38
38
38
38
38
38
38
38
38
1
2
3
4
5
6
7
8
9
10
11
12
13
14
15
16
17
18
19
20
21
22
23
24
25
26
27
28
29
30
31
32
33
34
35
36
37
38
39
40
41
42
43
44
45
46
47
48
49
50
51
52
53
54
55
56
57
58
59
60
61
62
63
64
65
66
67
68
69
70
71
72
73
74
75
76
77
78
79
80
81
82
83
84
85
86
87
88
89
90
91
92
93
94
95
96
97
98
99
100
101
102
103
104
105
106
107
108
109
110
111
112
113
114
115
116
117
118
119
120
121
122
123
124
125
126
127
128
129
130
131
132
133
<!DOCTYPE html>
<html>
  <head>
    <meta charset="utf-8" />
    <meta
      name="viewport"
      content="initial-scale=1,maximum-scale=1,user-scalable=no"
    />
    <title>
      GeoScene Developer Guide: Arcade-Unique types
    </title>

    <link
      rel="stylesheet"
      href="https://js.geoscene.cn/4.23/geoscene/themes/light/main.css"
    />
    <script src="https://js.geoscene.cn/4.23/"></script>

    <style>
      html,
      body,
      #viewDiv {
        padding: 0;
        margin: 0;
        height: 100%;
        width: 100%;
        background-color: rgba(15, 15, 15, 1);
      }
    </style>

    <script type="text/arcade" id="traffic-classification">

      var traffic = $feature.AADT;
      When(
        traffic > 80000, "High",
        traffic > 20000, "Medium",
        "Low"
      );

    </script>

    <script>
      require([
        "geoscene/config",
        "geoscene/Map",
        "geoscene/views/MapView",
        "geoscene/layers/FeatureLayer",
        "geoscene/widgets/Legend",
        "geoscene/widgets/Expand"
      ], function (geosceneConfig,Map, MapView, FeatureLayer, Legend, Expand) {

        geosceneConfig.apiKey = "YOUR_API_KEY";

        const renderer = {
          type: "unique-value",
          valueExpression: `
            var traffic = $feature.AADT;
            When(
              traffic > 80000, "High",
              traffic > 20000, "Medium",
              "Low"
            );
          `,
          valueExpressionTitle: "Traffic volume",
          uniqueValueInfos: [{
            value: "High",
            symbol: {
              type: "simple-line",
              color: "#810f7c",
              width: "6px",
              style: "solid"
            }
          }, {
            value: "Medium",
            symbol: {
              type: "simple-line",
              color: "#8c96c6",
              width: "3px",
              style: "solid"
            }
          }, {
            value: "Low",
            symbol: {
              type: "simple-line",
              color: "#9d978b",
              width: "1px",
              style: "solid"
            }
          }]
        };


        // Set the renderer on the layer
        const layer = new FeatureLayer({
          url: "https://services.arcgis.com/V6ZHFr6zdgNZuVG0/arcgis/rest/services/Florida_Annual_Average_Daily_Traffic/FeatureServer/0",
          renderer: renderer,
          title: "Annual average daily traffic",
          minScale: 0,
          maxSclae: 0
        });

        // Add the layer to the map
        const map = new Map({
          basemap: "geoscene-light-gray",
          layers: [layer]
        });

        const view = new MapView({
          container: "viewDiv",
          map: map,
          center: [-80.215, 25.856 ],
          rotation: 90,
          scale: 144447,
          constraints: {
            snapToZoom:false
          }
        });

        view.ui.add(new Expand({
          content:  new Legend({
            view: view
          }),
          view: view,
          expanded: true
        }), "top-right");
      });
    </script>
  </head>

  <body>
    <div id="viewDiv"></div>
  </body>
</html>
在 valueExpression 属性中引用 Arcade 表达式
53
53
53
53
53
53
53
53
53
53
53
53
53
53
53
53
53
53
53
53
53
53
53
53
53
53
53
53
53
53
53
53
53
53
53
53
53
53
53
53
53
53
53
53
53
53
53
53
53
53
53
53
53
54
55
56
57
58
59
60
61
62
63
64
65
66
67
68
69
70
71
72
73
74
75
76
77
78
79
80
81
82
83
84
85
86
87
88
89
90
90
90
90
90
90
90
90
90
90
90
90
90
90
90
90
90
90
90
90
90
90
90
90
90
90
90
90
90
90
90
90
90
90
90
90
90
90
90
90
90
90
90
90
1
2
3
4
5
6
7
8
9
10
11
12
13
14
15
16
17
18
19
20
21
22
23
24
25
26
27
28
29
30
31
32
33
34
35
36
37
38
39
40
41
42
43
44
45
46
47
48
49
50
51
52
53
54
55
56
57
58
59
60
61
62
63
64
65
66
67
68
69
70
71
72
73
74
75
76
77
78
79
80
81
82
83
84
85
86
87
88
89
90
91
92
93
94
95
96
97
98
99
100
101
102
103
104
105
106
107
108
109
110
111
112
113
114
115
116
117
118
119
120
121
122
123
124
125
126
127
128
129
130
131
132
133
<!DOCTYPE html>
<html>
  <head>
    <meta charset="utf-8" />
    <meta
      name="viewport"
      content="initial-scale=1,maximum-scale=1,user-scalable=no"
    />
    <title>
      GeoScene Developer Guide: Arcade-Unique types
    </title>

    <link
      rel="stylesheet"
      href="https://js.geoscene.cn/4.23/geoscene/themes/light/main.css"
    />
    <script src="https://js.geoscene.cn/4.23/"></script>

    <style>
      html,
      body,
      #viewDiv {
        padding: 0;
        margin: 0;
        height: 100%;
        width: 100%;
        background-color: rgba(15, 15, 15, 1);
      }
    </style>

    <script type="text/arcade" id="traffic-classification">

      var traffic = $feature.AADT;
      When(
        traffic > 80000, "High",
        traffic > 20000, "Medium",
        "Low"
      );

    </script>

    <script>
      require([
        "geoscene/config",
        "geoscene/Map",
        "geoscene/views/MapView",
        "geoscene/layers/FeatureLayer",
        "geoscene/widgets/Legend",
        "geoscene/widgets/Expand"
      ], function (geosceneConfig,Map, MapView, FeatureLayer, Legend, Expand) {

        geosceneConfig.apiKey = "YOUR_API_KEY";

        const renderer = {
          type: "unique-value",
          valueExpression: `
            var traffic = $feature.AADT;
            When(
              traffic > 80000, "High",
              traffic > 20000, "Medium",
              "Low"
            );
          `,
          valueExpressionTitle: "Traffic volume",
          uniqueValueInfos: [{
            value: "High",
            symbol: {
              type: "simple-line",
              color: "#810f7c",
              width: "6px",
              style: "solid"
            }
          }, {
            value: "Medium",
            symbol: {
              type: "simple-line",
              color: "#8c96c6",
              width: "3px",
              style: "solid"
            }
          }, {
            value: "Low",
            symbol: {
              type: "simple-line",
              color: "#9d978b",
              width: "1px",
              style: "solid"
            }
          }]
        };


        // Set the renderer on the layer
        const layer = new FeatureLayer({
          url: "https://services.arcgis.com/V6ZHFr6zdgNZuVG0/arcgis/rest/services/Florida_Annual_Average_Daily_Traffic/FeatureServer/0",
          renderer: renderer,
          title: "Annual average daily traffic",
          minScale: 0,
          maxSclae: 0
        });

        // Add the layer to the map
        const map = new Map({
          basemap: "geoscene-light-gray",
          layers: [layer]
        });

        const view = new MapView({
          container: "viewDiv",
          map: map,
          center: [-80.215, 25.856 ],
          rotation: 90,
          scale: 144447,
          constraints: {
            snapToZoom:false
          }
        });

        view.ui.add(new Expand({
          content:  new Legend({
            view: view
          }),
          view: view,
          expanded: true
        }), "top-right");
      });
    </script>
  </head>

  <body>
    <div id="viewDiv"></div>
  </body>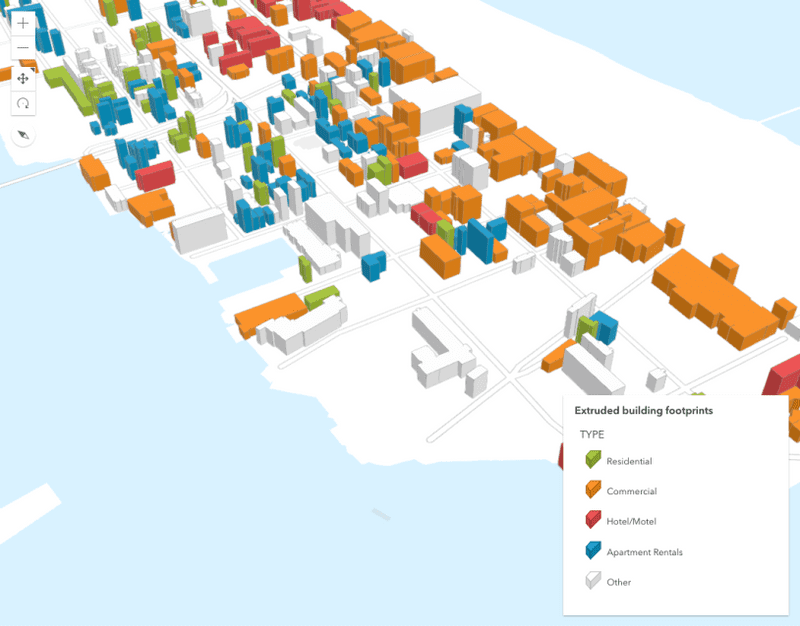
</html>分类数据 (3D)
此示例根据建筑物类型进行可视化:住宅、商业或混合用途。唯一值渲染根据建筑物的用途属性为每个建筑物分配颜色。
步骤
- 为每种建筑物类型创建不同的符号。
- 将符号分配给唯一值渲染器。
- 将渲染器分配给场景图层。
37
37
37
37
37
37
37
37
37
37
37
37
37
37
37
37
37
37
37
37
37
37
37
37
37
37
37
37
37
37
37
37
37
37
37
37
37
38
39
40
41
42
43
44
45
46
47
48
49
50
51
52
53
54
55
56
57
58
59
60
61
62
63
64
65
66
67
68
69
70
71
72
73
74
75
76
77
78
79
80
81
82
83
84
85
86
87
88
89
90
91
92
93
94
95
96
97
98
99
100
101
102
103
104
105
106
107
108
108
108
108
108
108
108
108
108
108
108
108
108
108
108
108
108
108
108
108
108
108
108
108
108
108
108
108
108
108
108
108
108
108
108
108
108
108
108
108
1
2
3
4
5
6
7
8
9
10
11
12
13
14
15
16
17
18
19
20
21
22
23
24
25
26
27
28
29
30
31
32
33
34
35
36
37
38
39
40
41
42
43
44
45
46
47
48
49
50
51
52
53
54
55
56
57
58
59
60
61
62
63
64
65
66
67
68
69
70
71
72
73
74
75
76
77
78
79
80
81
82
83
84
85
86
87
88
89
90
91
92
93
94
95
96
97
98
99
100
101
102
103
104
105
106
107
108
109
110
111
112
113
114
115
116
117
118
119
120
121
122
123
124
125
126
127
128
129
130
131
132
133
134
135
136
137
138
139
140
141
142
143
144
145
146
147
<!DOCTYPE html>
<html>
  <head>
    <meta charset="utf-8" />
    <meta
      name="viewport"
      content="initial-scale=1,maximum-scale=1,user-scalable=no"
    />
    <title>
      GeoScene Developer Guide: Visualize buildings by type
    </title>

    <link rel="stylesheet" href="https://js.geoscene.cn/4.23/geoscene/themes/light/main.css" />
    <script src="https://js.geoscene.cn/4.23/"></script>

    <style>
      html,
      body,
      #viewDiv {
        padding: 0;
        margin: 0;
        height: 100%;
        width: 100%;
      }
    </style>

    <script>
      require([
        "geoscene/config",
        "geoscene/Map",
        "geoscene/views/SceneView",
        "geoscene/layers/SceneLayer",
        "geoscene/widgets/Legend",
      ], function(geosceneConfig,Map, SceneView, SceneLayer, Legend) {

        geosceneConfig.apiKey = "YOUR_API_KEY";

        const typeRenderer = {
          type: "unique-value",
          legendOptions: {
            title: "Building Type",
          },
          defaultSymbol: {
            type: "mesh-3d",
            symbolLayers: [
              {
                type: "fill",
                material: { color: "#FFB55A", colorMixMode: "replace" },
              },
            ],
            value: "Others"
          },
          field: "landuse",
          uniqueValueInfos: [
            {
              value: "MIPS",
              symbol: {
                type: "mesh-3d",
                symbolLayers: [
                  {
                    type: "fill",
                    material: { color: "#FD7F6F", colorMixMode: "replace" },
                  },
                ],
              },
              label: "Office",
            },
            {
              value: "RESIDENT",
              symbol: {
                type: "mesh-3d",
                symbolLayers: [
                  {
                    type: "fill",
                    material: { color: "#7EB0D5", colorMixMode: "replace" },
                  },
                ],
              },
              label: "Residential",
            },
            {
              value: "MIXRES",
              symbol: {
                type: "mesh-3d",
                symbolLayers: [
                  {
                    type: "fill",
                    material: { color: "#BD7EBE", colorMixMode: "replace" },
                  },
                ],
              },
              label: "Mixed use",
            },
            {
              value: "MIXED",
              symbol: {
                type: "mesh-3d",
                symbolLayers: [
                  {
                    type: "fill",
                    material: { color: "#B2E061", colorMixMode: "replace" },
                  },
                ],
              },
              label: "Mixed use without residential",
            },
          ],
        }


        // Set the renderer on the layer
        const buildingLayer = new SceneLayer({
          url:
            "https://services.arcgis.com/V6ZHFr6zdgNZuVG0/arcgis/rest/services/SF_BLDG_WSL1/SceneServer/0",
          renderer: typeRenderer,
          title: "San Francisco Buildings",
        })

        // Add the layer to the map
        const map = new Map({
         basemap: "geoscene-light-gray",
          layers: [buildingLayer],
        })

        const view = new SceneView({
          container: "viewDiv",
          map: map,
          camera: {
            position: [-122.3966368, 37.77924265, 1294.5539],
            heading: 346.67,
            tilt: 46.8,
          },
        })

        const legend = new Legend({
          view: view,
        })

        view.ui.add(legend, "top-right")
      })
    </script>
  </head>

  <body>
    <div id="viewDiv"></div>
  </body>
</html>相关示例和资源

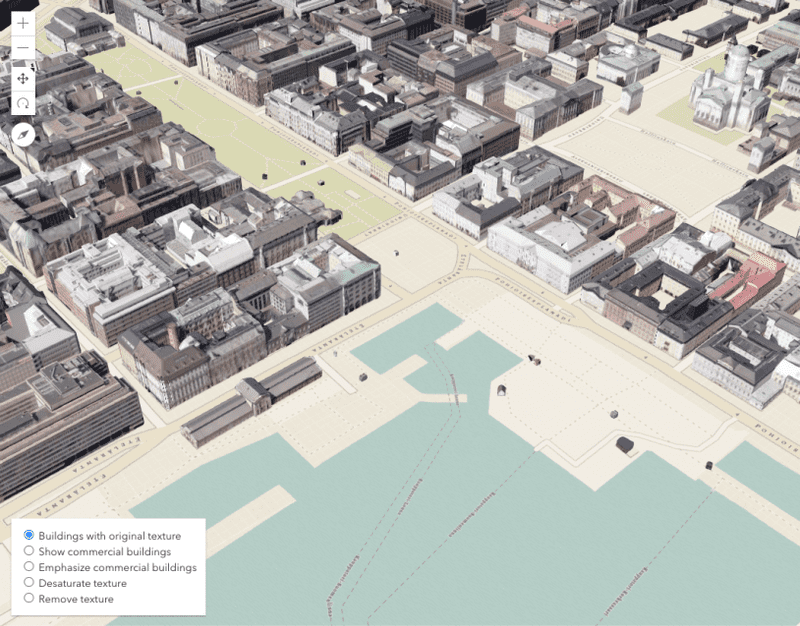
纹理建筑的着色选项
纹理建筑的着色选项

使用 Arcade 创建自定义可视化
使用 Arcade 创建自定义可视化

基于真实世界高度拉伸建筑物覆盖区
基于真实世界高度拉伸建筑物覆盖区

按类型可视化要素
按类型可视化要素

生成唯一值的数据驱动型可视化
生成唯一值的数据驱动型可视化