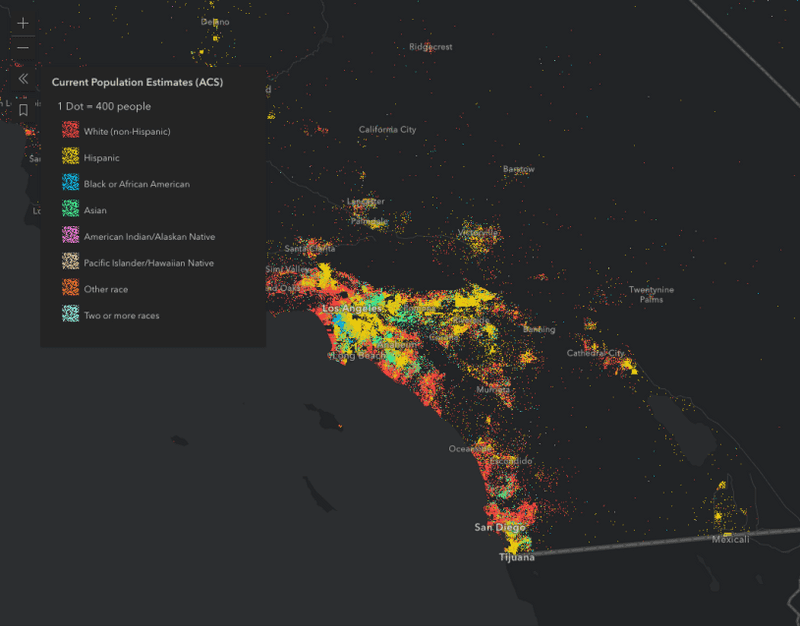
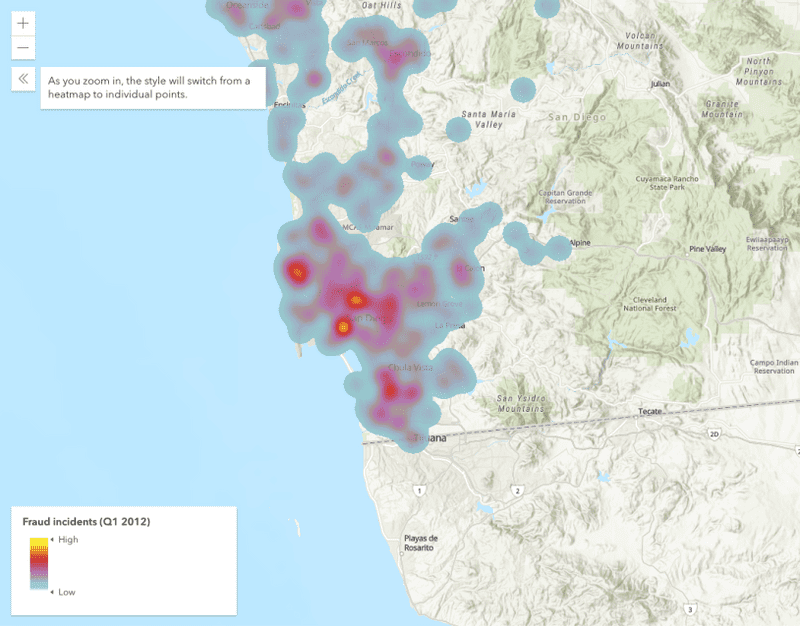
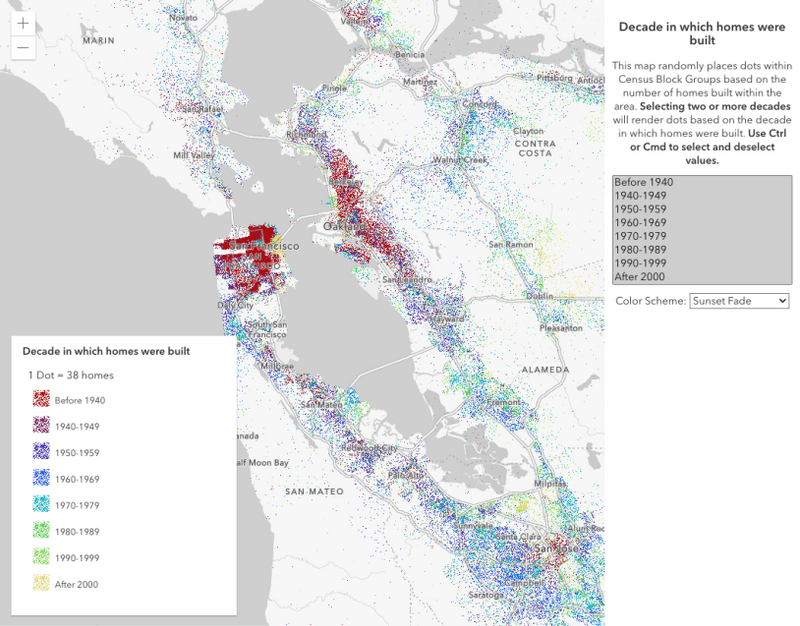
比例感知型可视化

使用点密度渲染器样式化人口普查区,以按种族和民族显示人口密度

为什么视图比例很重要?

Web 地图通常跨越多个比例级别。这使得设置图层样式变得很复杂。 例如,您可以在一个比例下定义效果很好的图标大小,但放大或缩小会很快将您的最佳制图决策转变为普通决策。

实际上,一个图标大小通常不适合所有比例。这对于密集图层尤其如此。例如,下图中的点在国家比例下大小为 10px 时看起来不错。 

10px icons at larger scales

A:在此比例下,点的合适大小是 10px。

但是,当缩小到全球范围时,10px 在密集区域中显得太大。大图标会遮盖基础数据,从而可能使人误解其密度。

10px icons at a worldwide scale

B:在此比例下,10px 点太大。

使用较小的点符号,可以减少或消除上面列出的许多问题。

3px icons at a world scale

C:在此比例下,3px 点看起来更好。

但是,当您放大到区域比例或更大比例时,几乎不可能看到这些 3px 大小的点。

3px icons at a national scale

D 在此比例下,3px 点是很难看到的。

比例相关属性

由于图标大小、线宽和密度不能在所有比例下都很好地显示,因此 GeoScene JS API 允许您根据视图比例配置各种符号和渲染器属性。

以下符号和渲染器属性可根据视图比例进行调整。

  1. 符号大小
  2. 多边形轮廓宽度
  3. 数据驱动大小范围 (即分级符号)
  4. 点密度值

符号大小

可使用大小视觉变量动态更改点大小和线宽,以便其在任何比例下都能正常工作。您必须添加一个 Arcade 表达式。以将视图比例返回到大小变量(例如 $view.scale)。然后,可将特定比例值映射到 stops 属性中的大小。所有其他比例级别将线性插值大小。

以下代码片段将视图比例视为一个数据值。返回原始比例值,大小停止点中的值对应于比例级别。渲染器将以停止点中每个比例指示的大小显示点大小(或线宽)。

                
1
2
3
4
5
6
7
8
9
10
11
12
13
14
15
16
renderer.visualVariables = [
  {
    type: "size",
    valueExpression: "$view.scale",
    stops: [
      // view scales larger than 1:1,155,581
      // will have a symbol size of 7.5 pts
      { size: 7.5, value: 1155581 },
      { size: 6, value: 9244648 },
      { size: 3, value: 73957190 },
      // view scales smaller than 1:591,657,527
      // will have a symbol size of 1.5 pts
      { size: 1.5, value: 591657527 }
    ]
  }
];

示例

以下示例演示如何按视图比例调整点的大小。此大小变量可用于任何点或线可视化,无论渲染器类型如何(只要它支持视觉变量)。

使用 关闭/开启按比例调整符号大小 按钮可以探索不按比例调整图标大小如何影响各种比例级别的可视化效果。

按比例改变图标大小
58 58 58 58 58 58 58 58 58 58 58 58 58 58 58 58 58 58 58 58 58 58 58 58 58 58 58 58 58 58 58 58 58 58 58 58 58 58 58 58 58 58 58 58 58 58 58 58 58 58 58 58 58 58 58 58 58 58 59 60 61 62 63 64 65 66 67 68 69 70 71 72 73 74 75 76 77 78 79 80 81 82 83 84 85 86 87 87 87 87 87 87 87 87 87 87 87 87 87 87 87 87 87 87 87 87 87 87 87 87 87 87 87 87 87 87 87 87 87 87 87 87 87 87 87 87 87 87 87 87 87 87 87 87 87 87 87 87 87 87 87 87 87 87 87 87 87 87 87 87 87 87 87 87 87 87 87 87 87 87 87 87 87 87 87 87 87 87 87 87 87 87 87 87 87 87 87 87 87 87 87 87 87 87 87 87 87 87 87 87 87 87 87 87 87 87 87 87 87 87 87 87 87 87 87 87 87 87 87 87 87 87 87 87 87 87 87 87 87 87 87 87 87 87 87 87 87 87 87 87 87 87 87 87 87 87 87 87 87 87 87 87 87 87 87 87 87 87 87 87 87 87 87 87 87 87 87 87 87 87 87 87 87 87 87 87 87 87 87 87 87 87 87 87 87 87 87 87 87 87 87 87 87 87 87 87 87 87 87 87 87 87 87 87 87 87 87 87 87 87 87 87 87 87 87 87 87 87 87 87 87 87 87 87 87 87 87 87 87 87 87 87 87 87 87 87 87 87 87
1
2
3
4
5
6
7
8
9
10
11
12
13
14
15
16
17
18
19
20
21
22
23
24
25
26
27
28
29
30
31
32
33
34
35
36
37
38
39
40
41
42
43
44
45
46
47
48
49
50
51
52
53
54
55
56
57
58
59
60
61
62
63
64
65
66
67
68
69
70
71
72
73
74
75
76
77
78
79
80
81
82
83
84
85
86
87
88
89
90
91
92
93
94
95
96
97
98
99
100
101
102
103
104
105
106
107
108
109
110
111
112
113
114
115
116
117
118
119
120
121
122
123
124
125
126
127
128
129
130
131
132
133
134
135
136
137
138
139
140
141
142
143
144
145
146
147
148
149
150
151
152
153
154
155
156
157
158
159
160
161
162
163
164
165
166
167
168
169
170
171
172
173
174
175
176
177
178
179
180
181
182
183
184
185
186
187
188
189
190
191
192
193
194
195
196
197
198
199
200
201
202
203
204
205
206
207
208
209
210
211
212
213
214
215
216
217
218
219
220
221
222
223
224
225
226
227
228
229
230
231
232
233
234
235
236
237
238
239
240
241
242
243
244
245
246
247
248
249
250
251
252
253
254
255
256
257
258
259
260
261
262
263
264
265
266
267
268
269
270
271
272
273
274
275
276
277
278
279
280
281
282
283
284
285
286
287
288
289
290
291
292
293
294
295
296
297
298
299
300
301
302
303
304
305
306
307
308
309
310
311
312
313
314
315
316
317
318
319
320
321
322
323
324
325
326
327
328
329
<!DOCTYPE html>
<html>
  <head>
    <meta charset="utf-8" />
    <meta name="viewport" content="initial-scale=1,maximum-scale=1,user-scalable=no" />
    <title>Vary point sizes by scale</title>

    <style>
      html,
      body,
      #viewDiv {
        height: 100%;
        width: 100%;
        margin: 0;
        padding: 0;
      #infoDiv {
        background: white;
        padding: 10px;
      #codeDiv {
        color: rgb(148, 4, 40);
        overflow-y: auto;
        /* overflow: scroll; */
        max-height: 250px;
      #scaleInfo {
        background: white;
        padding: 10px;
        font-family: monospace;
    </style>

    <link rel="stylesheet" href="https://js.geoscene.cn/4.23/geoscene/themes/light/main.css" />
    <script src="https://js.geoscene.cn/4.23/"></script>

    <script>
      require([
        "geoscene/Map",
        "geoscene/views/MapView",
        "geoscene/layers/FeatureLayer",
        "geoscene/renderers/SimpleRenderer",
        "geoscene/widgets/Expand",
        "geoscene/widgets/Home",
        "geoscene/widgets/Bookmarks",
        "geoscene/webmap/Bookmark"
      ], function(
        Map,
      ) {

        const sizeVV = {
          type: "size",

          valueExpression: "$view.scale",

          stops: [
            { size: 9, value: 1155581 },
            { size: 6, value: 9244648 },
            { size: 3, value: 73957190 },
            { size: 1.5, value: 591657527 }
          ]
        };


        const renderer = new SimpleRenderer({
          symbol: {
            type: "simple-marker",
            color: "dodgerblue",
            outline: {
              color: [255, 255, 255, 0.7],
              width: 0.5
            },
            size: "3px"
          },

          visualVariables: [ sizeVV ]

        });
        const layer = new FeatureLayer({
          portalItem: {
            id: "cb1886ff0a9d4156ba4d2fadd7e8a139"
          renderer: renderer
        const spatialReference = {
          wkid: 54035
        const baseLayer = new FeatureLayer({
          portalItem: {
            id: "2b93b06dc0dc4e809d3c8db5cb96ba69"
          legendEnabled: false,
          popupEnabled: false,
          renderer: {
            type: "simple",
            symbol: {
              type: "simple-fill",
              color: [200, 200, 200, 0.75],
              outline: {
                color: "white",
                width: 0.5
        const map = new Map({
          layers: [baseLayer, layer]
        const view = new MapView({
          container: "viewDiv",
          map: map,
          center: {
            x: 0,
            y: 0,
          scale: 200000000,
          constraints: {
            rotationEnabled: false
          graphics: [
              symbol: {
                type: "simple-fill",
                color: null,
                outline: {
                  width: 1,
                  color: [200, 200, 200, 0.75]
              geometry: {
                type: "extent",
                xmin: -180,
                xmax: 180,
                ymin: -90,
                ymax: 90,
                spatialReference: { wkid: 4326 }
        view.ui.add(new Home({ view: view }), "top-left");
        view.ui.add(new Expand({
          view: view,
          group: "top-left",
          content: new Bookmarks({
            view: view,
            bookmarks: [
              new Bookmark({
                name: "Worldwide",
                viewpoint: {
                  rotation: 0,
                  scale: 100000000,
                  targetGeometry: {
                    type: "extent",
                    spatialReference: {
                      wkid: 54035
                    xmin: -18825141.816950303,
                    ymin: -10953771.907543816,
                    xmax: 18825141.816950303,
                    ymax: 10953771.907543816
              new Bookmark({
                name: "United Kingdom",
                viewpoint: {
                  rotation: 0,
                  scale: 5928725.090579714,
                  targetGeometry: {
                    type: "extent",
                      spatialReference: {
                        wkid: 54035
                      xmin: -1441704.7573362407,
                      ymin: 5722452.8511557,
                      xmax: 790477.055141252,
                      ymax: 7021290.898050545
        }), "top-left");
        const scaleInfo = document.getElementById("scaleInfo");
        const infoExpand = new Expand({
          content: scaleInfo,
          view: view,
          group: "top-left"
        view.ui.add(infoExpand, "top-left");
        const infoDiv = document.getElementById("infoDiv");
        view.ui.add(infoDiv, "top-right");
        const toggleButton = document.getElementById("toggle-auto-size");
        toggleButton.addEventListener("click", toggleAutoSize);
        const codeElement = document.getElementById("codeDiv");
        const viewScaleElement = document.getElementById("viewScale");
        const sizeElement = document.getElementById("size");
        let scaleWatchHandle;
        function toggleAutoSize() {
          let sizeOptimizationEnabled = false;
          if (toggleButton.innerText === "Enable auto size by scale") {
            toggleButton.innerText = "Disable auto size by scale";
            sizeOptimizationEnabled = true;
          } else {
            toggleButton.innerText = "Enable auto size by scale";
          const renderer = layer.renderer.clone();
          if(renderer.visualVariables && renderer.visualVariables.length>0){
            renderer.symbol.size = getSizeFromScale(renderer.visualVariables[0], view.scale);
          renderer.visualVariables = sizeOptimizationEnabled ? [sizeVV] : null;
          if(renderer.visualVariables){
            const scaleVVs = getScaleVariables(renderer.visualVariables);
            const scaleVVsStringified = JSON.stringify(scaleVVs, null, 2);
            codeElement.innerHTML = `<pre>${scaleVVsStringified}</pre>`;
            scaleWatchHandle = view.watch("scale", displayScaleAndSizeValues);
            function displayScaleAndSizeValues(scale){
              viewScaleElement.innerHTML = Math.round(scale);
              const effectiveSize = getSizeFromScale(scaleVVs[0], scale);
              sizeElement.innerHTML = effectiveSize.toPrecision(2);
        function getScaleVariables(visualVariables){
          return visualVariables.filter(function(vv){
            return vv.valueExpression && vv.valueExpression === "$view.scale";
        function clearInfoDisplay(){
          sizeElement.innerHTML = null;
          viewScaleElement.innerHTML = null;
          codeElement.innerHTML = null;
          scaleWatchHandle = null;
          infoExpand.expanded = false;
        function getSizeFromScale(sizeVV, scale){
          const sizeStops = sizeVV.stops;
          const stopsCount = sizeStops.length;
          const finalIndex = stopsCount-1;
          const scaleMin = sizeStops[0].value;
          const scaleMax = sizeStops[finalIndex].value;
          if(scale <= scaleMin){
            return sizeStops[0].size;
          if(scale >= scaleMax){
            return sizeStops[finalIndex].size;
          for (let i = 0; i <= finalIndex; i++){
            const currentStop = sizeStops[i];
            const nextStop = sizeStops[i+1];
            if(scale >= currentStop.value && scale < nextStop.value){
              const scaleRange = nextStop.value - currentStop.value;
              const sizeRange  = currentStop.size - nextStop.size;
              const relativePosition = (scale - currentStop.value) / scaleRange;
              const effectiveSize = currentStop.size - (sizeRange * relativePosition);
              return effectiveSize;
    </script>
  </head>

  <body>
    <div id="viewDiv"></div>
    <div id="infoDiv" class="geoscene-widget">
      <button id="toggle-auto-size" class="geoscene-button">
        Enable auto size by scale
      </button>
    </div>
    <div id="scaleInfo">
      <div id="scaleDiv">View scale: <span id="viewScale"></span></div>
      <div id="sizeDiv">Icon size (pt): <span id="size"></span></div>
      <div id="codeDiv"></div>
    </div>
  </body>
</html>

多边形轮廓

轮廓过粗可能会隐藏小要素,并分散可视化效果的目的。因此,许多人会直觉地移除轮廓。但是,这种做法可能会产生问题。

例如,下图显示了非常粗的轮廓,它们完全遮挡了休斯顿市中心区域中小多边形的填充颜色。

Large outlines zoomed out

E:在此比例下,粗轮廓遮挡了大量的要素,使视觉效果难以解读。

这种轮廓宽度显然是不可接受的,但是,如果缩放到非常大的比例,该轮廓选择实际上效果很好。

Large outlines zoomed in

F:在此比例下,粗轮廓不会分散视觉或模糊要素。

在大比例下移除轮廓后,将无法看到具有相同颜色的相邻要素的边界。

side-by-side zoomed in outlines

G:左图显示,移除轮廓会导致无法看到相似要素的边界。右图显示,添加轮廓可使这些边界清晰可见。

与按比例调整符号大小类似,可以使用 $view.scale Arcade 表达式通过大小视觉变量来调整多边形轮廓宽度。此方案需要将 target 属性设置为 outline,以便渲染器知道将大小变量应用于符号轮廓。

             
1
2
3
4
5
6
7
8
9
10
11
12
13
renderer.visualVariables = [
  {
    type: "size",
    valueExpression: "$view.scale",
    target: "outline",
    stops: [
      { size: 2, value: 56187 },
      { size: 1, value: 175583 },
      { size: 0.5, value: 702332 },
      { size: 0, value: 1404664 }
    ]
  }
];

示例

以下示例演示了如何按视图比例调整多边形的轮廓。放大以观察轮廓的加粗过程。缩小以查看轮廓变细并最终消失的过程。

按比例改变轮廓宽度
95 95 95 95 95 95 95 95 95 95 95 95 95 95 95 95 95 95 95 95 95 95 95 95 95 95 95 95 95 95 95 95 95 95 95 95 95 95 95 95 95 95 95 95 95 95 95 95 95 95 95 95 95 95 95 95 95 95 95 95 95 95 95 95 95 95 95 95 95 95 95 95 95 95 95 95 95 95 95 95 95 95 95 95 95 95 95 95 95 95 95 95 95 95 95 96 97 98 99 100 101 102 103 104 105 106 106 106 106 106 106 106 106 106 106 106 106 106 106 106 106 106 106 106 106 106 106 106 106 106 106 106 106 106 106 106 106 106 106 106 106 106 106 106 106 106 106 106 106 106 106 106 106 106 106 106
1
2
3
4
5
6
7
8
9
10
11
12
13
14
15
16
17
18
19
20
21
22
23
24
25
26
27
28
29
30
31
32
33
34
35
36
37
38
39
40
41
42
43
44
45
46
47
48
49
50
51
52
53
54
55
56
57
58
59
60
61
62
63
64
65
66
67
68
69
70
71
72
73
74
75
76
77
78
79
80
81
82
83
84
85
86
87
88
89
90
91
92
93
94
95
96
97
98
99
100
101
102
103
104
105
106
107
108
109
110
111
112
113
114
115
116
117
118
119
120
121
122
123
124
125
126
127
128
129
130
131
132
133
134
135
136
137
138
139
140
141
142
143
144
145
146
147
148
149
150
151
152
153
154
155
156
<!DOCTYPE html>
<html>
  <head>
    <meta charset="utf-8" />
    <meta name="viewport" content="initial-scale=1,maximum-scale=1,user-scalable=no" />
    <title>
      GeoScene Developer Guide: Class breaks
    </title>

    <link rel="stylesheet" href="https://js.geoscene.cn/4.23/geoscene/themes/light/main.css" />
    <script src="https://js.geoscene.cn/4.23/"></script>

    <style>
      html,
      body,
      #viewDiv {
        padding: 0;
        margin: 0;
        height: 100%;
        width: 100%;
    </style>

    <script>
      require([
        "geoscene/config",
        "geoscene/Map",
        "geoscene/renderers/ClassBreaksRenderer",
        "geoscene/views/MapView",
        "geoscene/layers/FeatureLayer",
        "geoscene/widgets/Legend",
        "geoscene/widgets/Expand",
      ], function (geosceneConfig,Map, ClassBreaksRenderer, MapView, FeatureLayer, Legend, Expand) {
        geosceneConfig.apiKey = "YOUR_API_KEY";
        function createSymbol(color){
          return {
            type: "simple-fill",
            style: "solid",
            outline: {
              width: 0.2,
              color: [255, 255, 255, 0.2]
        const renderer = new ClassBreaksRenderer({
          field: "NOHS_CY",
          normalizationField: "EDUCBASECY",
          legendOptions: {
            title: "% of adults with no high school education"
          defaultSymbol: {
            type: "simple-fill",
            color: "black",
            style: "backward-diagonal",
            outline: {
              width: 0.5,
              color: [50, 50, 50, 0.6]
          defaultLabel: "no data",
          classBreakInfos: [
              minValue: 0,
              maxValue: 0.04999,
              symbol: createSymbol("#edf8fb"),
              label: "< 5%"
              minValue: 0.05,
              maxValue: 0.14999,
              symbol: createSymbol("#b3cde3"),
              label: "5 - 15%"
              minValue: 0.15,
              maxValue: 0.24999,
              symbol: createSymbol("#8c96c6"),
              label: "15 - 25%"
              minValue: 0.25,
              maxValue: 1.0,
              symbol: createSymbol("#88419d"),
              label: "> 25%"
        renderer.visualVariables = [ {
          type: "size",
          valueExpression: "$view.scale",
          target: "outline",
          stops: [
            { size: 2, value: 56187 },
            { size: 1, value: 175583 },
            { size: 0.5, value: 702332 },
            { size: 0, value: 1404664 }
          ]
        }];
        const layer = new FeatureLayer({
          portalItem: {
            id: "1cbb0faa0f1f424bbe213bfae9319309"
          title: "Census tracts",
          renderer: renderer,
          popupTemplate: {
            content: "{NOHS_CY} adults 25 years old and older in this census tract did not attend high school."
          opacity: 1
        const map = new Map({
          basemap: {
            portalItem: {
              id: "3582b744bba84668b52a16b0b6942544"
          layers: [ layer ],
          constraints: {
            snapToZoom: false
        const view = new MapView({
          container: "viewDiv",
          map: map,
          scale: 577790,
          center: [-117.8099, 34.0441]
        const legend = new Legend({
          view: view
        view.ui.add(new Expand({
          view: view,
          content: legend,
          expanded: true
        }), "top-right");
    </script>
  </head>

  <body>
    <div id="viewDiv"></div>
  </body>
</html>

数据驱动大小范围

您还可以按比例优化数据驱动连续大小(即分级符号)的可视化效果。这将导致整个符号范围在放大时变大,并在缩小时变小。当创建连续大小可视化时,设置与 minDataValuemaxDataValue 相对应的 minSizemaxSize

        
1
2
3
4
5
6
7
8
renderer.visualVariables = [{
  type: "size",
  field: "Population",
  minDataValue: 1,
  maxDataValue: 1000000,
  maxSize: 40,
  minSize: 4
}]

您可以按比例调整所有符号大小的范围,即使它们随数据值而变化。在此情景中,必须将与比例相关的大小变量设置为 maxSizeminSize 属性。请参阅下面的示例。

示例

以下示例演示了如何调整符号大小,这些符号大小随视图比例的数据值而变化。

按比例划分大小范围
98 98 98 98 98 98 98 98 98 98 98 98 98 98 98 98 98 98 98 98 98 98 98 98 98 98 98 98 98 98 98 98 98 98 98 98 98 98 98 98 98 98 98 98 98 98 98 98 98 98 98 98 98 98 98 98 98 98 98 98 98 98 98 98 98 98 98 98 98 98 98 98 98 98 98 98 98 98 98 98 98 98 98 98 98 98 98 98 98 98 98 98 98 98 98 98 98 98 99 100 101 102 103 104 105 106 107 108 109 110 111 112 113 114 115 116 117 118 119 120 121 122 123 124 125 126 127 127 127 127 127 127 127 127 127 127 127 127 127 127 127 127 127 127 127 127 127 127 127 127 127 127 127 127 127 127 127 127 127 127 127 127 127 127 127 127 127 127 127 127 127 127 127 127 127 127 127 127 127 127 127 127 127 127 127 127 127 127 127
1
2
3
4
5
6
7
8
9
10
11
12
13
14
15
16
17
18
19
20
21
22
23
24
25
26
27
28
29
30
31
32
33
34
35
36
37
38
39
40
41
42
43
44
45
46
47
48
49
50
51
52
53
54
55
56
57
58
59
60
61
62
63
64
65
66
67
68
69
70
71
72
73
74
75
76
77
78
79
80
81
82
83
84
85
86
87
88
89
90
91
92
93
94
95
96
97
98
99
100
101
102
103
104
105
106
107
108
109
110
111
112
113
114
115
116
117
118
119
120
121
122
123
124
125
126
127
128
129
130
131
132
133
134
135
136
137
138
139
140
141
142
143
144
145
146
147
148
149
150
151
152
153
154
155
156
157
158
159
160
161
162
163
164
165
166
167
168
169
170
171
172
173
174
175
176
177
178
179
180
181
182
183
184
185
186
187
188
189
<!DOCTYPE html>
<html>
  <head>
    <meta charset="utf-8" />
    <meta
      name="viewport"
      content="initial-scale=1,maximum-scale=1,user-scalable=no"
    />
    <title>Change in votes between parties</title>

    <link rel="stylesheet" href="https://js.geoscene.cn/4.23/geoscene/themes/light/main.css" />
    <script src="https://js.geoscene.cn/4.23/"></script>

    <style>
      html,
      body,
      #viewDiv {
        padding: 0;
        margin: 0;
        height: 100%;
        width: 100%;
    </style>

    <script>
      require([
        "geoscene/Map",
        "geoscene/views/MapView",
        "geoscene/layers/FeatureLayer",
        "geoscene/widgets/Expand",
        "geoscene/widgets/Legend"
      ], function (Map, MapView, FeatureLayer, Expand, Legend) {
        const sizeValueExpression = `
        `;
        const layer = new FeatureLayer({
          title: "2020 U.S. presidential election",
          portalItem: {
            id: "fe9e032e4a854c74890750214a3edd8b"
          renderer: {
            type: "unique-value",
            valueExpression: `
            `,
            valueExpressionTitle: "Predominant voter shift 2016-2020",
            uniqueValueInfos: [{
              value: "republican",
              label: "Republican",
              symbol: createSymbol("rgba(220, 75, 0, 1)")
              value: "democrat",
              label: "Democrat",
              symbol: createSymbol("rgba(60, 108, 204,1)")
              value: "other",
              label: "Other",
              symbol: createSymbol("rgba(181, 166, 0, 1)")
            visualVariables: [{
              type: "size",
              valueExpression: sizeValueExpression,
              valueExpressionTitle: "Shift in percentage points",
              minDataValue: 0,
              maxDataValue: 30,

              maxSize: {
                type: "size",
                valueExpression: "$view.scale",
                stops: [
                  { size: 42, value: 288895 },
                  { size: 38.6, value: 2311162 },
                  { size: 24, value: 18489297 },
                  { size: 11, value: 147914381 }
                ]
              },
              minSize: {
                type: "size",
                valueExpression: "$view.scale",
                stops: [
                  { size: 8, value: 288895 },
                  { size: 4, value: 2311162 },
                  { size: 1, value: 18489297 },
                  { size: 0.4, value: 147914381 }
                ]
              }

            }]
        function createSymbol(color){
          return {
            type: "simple-marker",
            style: "circle",
            outline: {
              width: 0.5,
              color: [ 255,255,255,0.3 ]
        const map = new Map({
          basemap: {
            portalItem: {
              id: "fbfb62f3599f41e5a77845f863e2872f"
          layers: [ layer ]
        const view = new MapView({
          container: `viewDiv`,
          center: [-95, 40],
          scale: 2311162 * 8,
          constraints: {
            minScale: 0,
            maxScale: 4622324/16,
            snapToZoom: false,
            rotationEnabled: false
          highlightOptions: {
            fillOpacity: 0
          breakpoints: {
            large: 1200,
            medium: 992,
            small: 768,
            xsmall: 544
          popup: {
            collapseEnabled: false
        view.ui.add(new Expand({
          content: new Legend({ view }),
        }), "bottom-left");
    </script>
  </head>

  <body>
    <div id="viewDiv"></div>
  </body>
</html>

点密度值

点密度可视化对视图比例很敏感。在常数点值下,当用户放大和缩小时,要素密度将显示不一致。DotDensityRenderer 允许您根据视图比例线性缩放点值。这是使用 referenceScale 属性配置的。放大和缩小初始视图时,点的相对密度在各比例下保持不变。

除了设置 referenceScale 之外,通常还应在图层上设置 minScale。当点不再可分辨时,点密度可视化很难解读,因为它们已合并或太分散。

在图层上设置 maxScale 也很重要,因为在较大比例下,点密度地图往往会变得无法解读。用户可能会开始看到点随机分布中的模式(在现实中不存在)。他们还可能错误地将每个点的位置解释为实际的点要素。当 dotValue 设置为 1 时,用户特别容易受到此影响。例如,县数据集上的点密度可视化应仅在州或区域级别查看。

示例

以下示例可视化了美国按种族划分的人口密度。在 1:577,790 的比例下,每个点代表 100 个人。dotValue 将在用户放大和缩小时自动调整。您可以在图例中注意到这一变化。

GeoScene JS API
75 75 75 75 75 75 75 75 75 75 75 75 75 75 75 75 75 75 75 75 75 75 75 75 75 75 75 75 75 75 75 75 75 75 75 75 75 75 75 75 75 75 75 75 75 75 75 75 75 75 75 75 75 75 75 75 75 75 75 75 75 75 75 75 75 75 75 75 75 75 75 75 75 75 75 76 77 78 79 80 81 82 83 83 83 83 83 83 83 83 83 83 83 83 83 83 83 83 83 83 83 83 83 83 83 83 83 83 83 83 83 83 83 83 83 83 83 83 83 83 83 83 83 83 83 83 83 83 83 83 83 83 83 83 83 83 83 83 83 83 83 83 83 83 83 83 83 83 83 83 83 83 83 83 83 83 83 83 83 83 83 83 83 83 83 83 83 83 83 83 83 83 83 83 83 83 83 83 83 83 83 83 83 83 83 83 83 83 83 83 83 83 83 83 83 83 83 83 83 83 83 83 83 83 83 83 83 83 83 83 83 83 83 83 83 83 83 83 83 83 83 83 83 83 83 83 83 83 83 83 83 83 83 83 83 83 83 83 83 83 83
1
2
3
4
5
6
7
8
9
10
11
12
13
14
15
16
17
18
19
20
21
22
23
24
25
26
27
28
29
30
31
32
33
34
35
36
37
38
39
40
41
42
43
44
45
46
47
48
49
50
51
52
53
54
55
56
57
58
59
60
61
62
63
64
65
66
67
68
69
70
71
72
73
74
75
76
77
78
79
80
81
82
83
84
85
86
87
88
89
90
91
92
93
94
95
96
97
98
99
100
101
102
103
104
105
106
107
108
109
110
111
112
113
114
115
116
117
118
119
120
121
122
123
124
125
126
127
128
129
130
131
132
133
134
135
136
137
138
139
140
141
142
143
144
145
146
147
148
149
150
151
152
153
154
155
156
157
158
159
160
161
162
163
164
165
166
167
168
169
170
171
172
173
174
175
176
177
178
179
180
181
182
183
184
185
186
187
188
189
190
191
192
193
194
195
196
197
198
199
200
201
202
203
204
205
206
207
208
209
210
211
212
213
214
215
216
217
218
219
220
221
222
223
224
225
226
227
228
229
230
231
232
233
234
235
236
237
238
239
240
241
<!DOCTYPE html>
<html>
  <head>
    <meta charset="utf-8" />
    <meta name="viewport" content="initial-scale=1,maximum-scale=1,user-scalable=no" />

    <title>GeoScene Developer Guide: Population density by race and ethnicity</title>

    <link rel="stylesheet" href="https://js.geoscene.cn/4.23/geoscene/themes/dark/main.css" />

    <style>
      html,
      body,
      #viewDiv {
        padding: 0;
        margin: 0;
        height: 100%;
        width: 100%;
    </style>

    <script src="https://js.geoscene.cn/4.23/"></script>

    <script>
      require([
       "geoscene/config",
        "geoscene/WebMap",
        "geoscene/views/MapView",
        "geoscene/layers/FeatureLayer",
        "geoscene/renderers/DotDensityRenderer",
        "geoscene/widgets/Legend",
        "geoscene/widgets/Bookmarks",
        "geoscene/widgets/Expand"
      ], function (
      ) {
        geosceneConfig.apiKey = "YOUR_API_KEY";
        const map = new WebMap({
          portalItem: {
            id: "56b5bd522c52409c90d902285732e9f1"
        const view = new MapView({
          container: "viewDiv",
          map: map,
          highlightOptions: {
            fillOpacity: 0,
            color: [50, 50, 50]
          popup: {
            dockEnabled: true,
            dockOptions: {
              position: "top-right",
              breakpoint: false
          constraints: {
            maxScale: 35000,
            snapToZoom: false
        view.when().then(function () {
          const dotDensityRenderer = new DotDensityRenderer({
            dotValue: 100,
            outline: null,
            referenceScale: 577790, // 1:577,790 view scale
            legendOptions: {
              unit: "people"
            }
          });
              field: "B03002_003E",
              color: "#f23c3f",
              label: "White (non-Hispanic)"
              field: "B03002_012E",
              color: "#e8ca0d",
              label: "Hispanic"
              field: "B03002_004E",
              color: "#00b6f1",
              label: "Black or African American"
              field: "B03002_006E",
              color: "#32ef94",
              label: "Asian"
              field: "B03002_005E",
              color: "#ff7fe9",
              label: "American Indian/Alaskan Native"
              field: "B03002_007E",
              color: "#e2c4a5",
              label: "Pacific Islander/Hawaiian Native"
              field: "B03002_008E",
              color: "#ff6a00",
              label: "Other race"
              field: "B03002_009E",
              color: "#96f7ef",
              label: "Two or more races"
          // Add renderer to the layer and define a popup template
          const url = "https://services.arcgis.com/P3ePLMYs2RVChkJx/arcgis/rest/services/ACS_Population_by_Race_and_Hispanic_Origin_Boundaries/FeatureServer/2";
          const layer = new FeatureLayer({
            url: url,
            minScale: 20000000,
            maxScale: 35000,
            title: "Current Population Estimates (ACS)",
            popupTemplate: {
              title: "{County}, {State}",
              content: [
                  type: "fields",
                  fieldInfos: [
                      fieldName: "B03002_003E",
                      label: "White (non-Hispanic)",
                      format: {
                        digitSeparator: true,
                        places: 0
                      fieldName: "B03002_012E",
                      label: "Hispanic",
                      format: {
                        digitSeparator: true,
                        places: 0
                      fieldName: "B03002_004E",
                      label: "Black or African American",
                      format: {
                        digitSeparator: true,
                        places: 0
                      fieldName: "B03002_006E",
                      label: "Asian",
                      format: {
                        digitSeparator: true,
                        places: 0
                      fieldName: "B03002_005E",
                      label: "American Indian/Alaskan Native",
                      format: {
                        digitSeparator: true,
                        places: 0
                      fieldName: "B03002_007E",
                      label: "Pacific Islander/Hawaiian Native",
                      format: {
                        digitSeparator: true,
                        places: 0
                      fieldName: "B03002_008E",
                      label: "Other race",
                      format: {
                        digitSeparator: true,
                        places: 0
                      fieldName: "B03002_009E",
                      label: "Two or more races",
                      format: {
                        digitSeparator: true,
                        places: 0
            renderer: dotDensityRenderer
              new Expand({
                view: view,
                content: new Legend({ view: view }),
                group: "top-right",
                expanded: true
              new Expand({
                view: view,
                content: new Bookmarks({ view: view }),
                group: "top-right"
            "top-right"
    </script>
  </head>

  <body>
    <div id="viewDiv"></div>
  </body>
</html>

Your browser is no longer supported. Please upgrade your browser for the best experience. See our browser deprecation post for more details.

Navigated to 比例感知型可视化