多元数据可视化
气象站采用单一渲染器和视觉变量进行样式化,以显示风速、方向和气温
什么是多元数据可视化?
多元数据可视化涉及在单一渲染器中可视化多个数据值。 这样做有很多原因,包括:
- 查看两个或多个变量之间的关系
- 比较或对比两个变量之间的差异
- 一次查看多个变量之间可能不相关的空间模式。
多元数据可视化的工作方法
多元可视化可以通过向单一渲染器添加多个视觉变量来完成。常见的组合包括:
- 颜色和大小
- 大小和旋转
- 大小、旋转和颜色
您还可以使用许多其他视觉变量组合(包括不透明度)来创建多元可视化。
示例
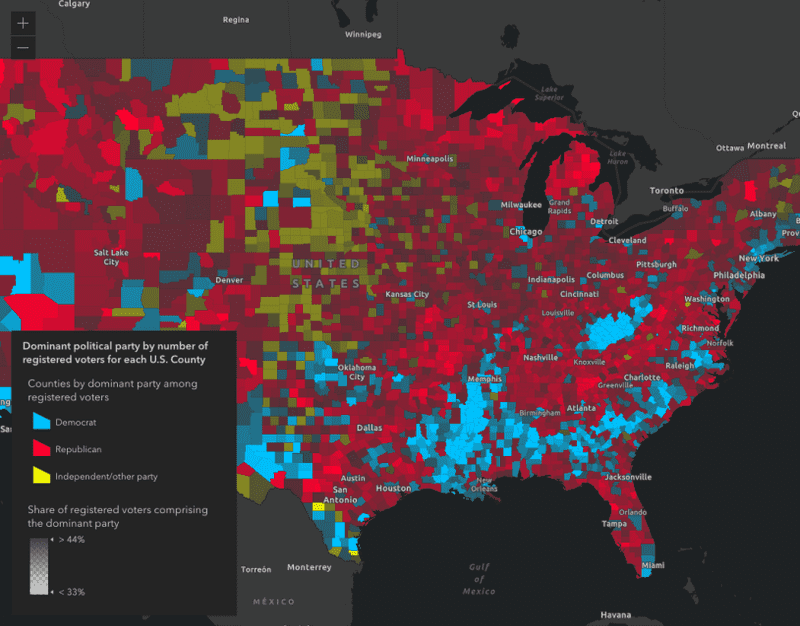
颜色和大小
颜色和大小通常用于显示两个变量之间的关系,或使用颜色变量显示比率,以及使用大小变量显示变量的大小。
以下示例用于可视化湿度如何影响炎热指数,或使用颜色和大小来“感知”温度。
- 颜色用于可视化相对湿度
- 大小用于可视化热指数(感知温度)与气象站测量的空气温度之间的差异。
GeoScene JS API
52
52
52
52
52
52
52
52
52
52
52
52
52
52
52
52
52
52
52
52
52
52
52
52
52
52
52
52
52
52
52
52
52
52
52
52
52
52
52
52
52
52
52
52
52
52
52
52
52
52
52
52
53
54
55
56
57
58
59
60
61
62
63
64
65
66
67
68
69
70
71
72
73
73
73
73
73
73
73
73
73
73
73
73
73
73
73
73
73
73
73
73
73
73
73
73
73
73
73
73
73
73
73
73
73
73
73
73
73
73
73
73
73
73
73
73
73
73
73
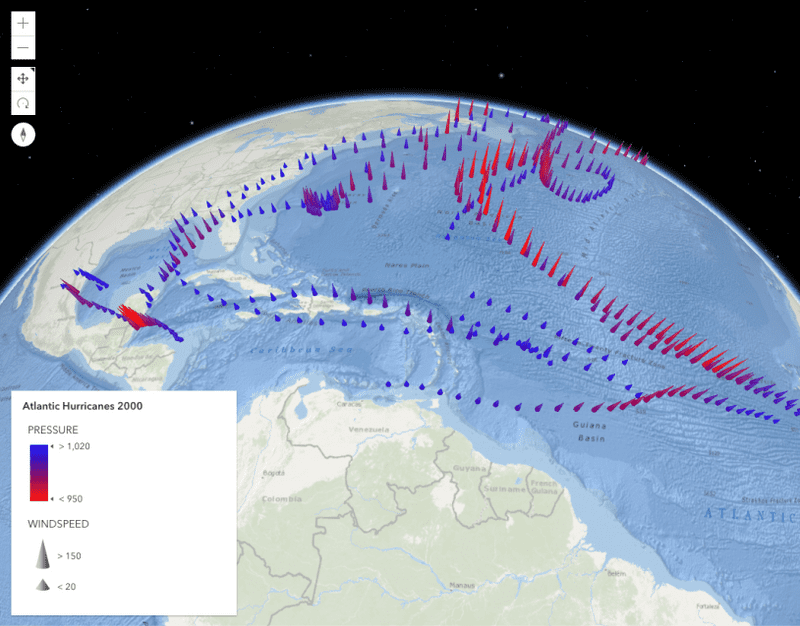
大小和旋转
大小变量适合用于可视化总计数或大小。旋转和大小通常一起使用以绘制天气数据,例如风。旋转表示流动的方向,而大小表示风速。
GeoScene JS API
57
57
57
57
57
57
57
57
57
57
57
57
57
57
57
57
57
57
57
57
57
57
57
57
57
57
57
57
57
57
57
57
57
57
57
57
57
57
57
57
57
57
57
57
57
57
57
57
57
57
57
57
57
57
57
57
57
58
59
60
61
62
63
64
65
66
67
68
69
70
71
71
71
71
71
71
71
71
71
71
71
71
71
71
71
71
71
71
71
71
71
71
71
71
71
71
71
71
71
71
71
71
71
71
71
71
71
71
71
71
71
71
71
71
71
71
71
71
大小、旋转和颜色
在极少数情况下,您可以有效地同时使用三个视觉变量。在以下示例中,我们向风可视化添加了一个颜色变量以表示气温。此可视化允许最终用户在一个视觉中同时查看风和温度的模式。
- 大小 - 风速
- 旋转 - 风向
- 颜色 - 气温
GeoScene JS API
57
57
57
57
57
57
57
57
57
57
57
57
57
57
57
57
57
57
57
57
57
57
57
57
57
57
57
57
57
57
57
57
57
57
57
57
57
57
57
57
57
57
57
57
57
57
57
57
57
57
57
57
57
57
57
57
57
58
59
60
61
62
63
64
65
66
67
68
69
70
71
72
73
74
75
76
77
78
79
80
81
82
83
84
85
86
87
88
89
90
91
92
93
94
95
96
97
98
99
100
101
102
103
103
103
103
103
103
103
103
103
103
103
103
103
103
103
103
103
103
103
103
103
103
103
103
103
103
103
103
103
103
103
103
103
103
103
103
103
103
103
103
103
103
103
103
103
103
103
最佳实践
需要注意的是,使用多个视觉变量会增加可视化的复杂性。这会使得最终用户更难理解所表达的信息。您应始终仔细考虑在一个视图中使用多个变量是否比显示数据的单独视图更可取。
其他多元样式
您不需要视觉变量来创建多元可视化。以下指南页面演示了如何使用其他渲染器类型创建多元可视化。
点密度
了解如何使用点密度来测量数值属性或一组类似变量的密度。
关系
了解如何使用关系渲染器来探索两个数值数据属性之间的关系。
相关示例和资源


具有视觉变量的点聚类
具有视觉变量的点聚类

使用 Arcade 创建自定义可视化
使用 Arcade 创建自定义可视化

主题多元可视化 (3D)
主题多元可视化 (3D)

根据真实世界尺寸 (2D) 缩放要素大小
根据真实世界尺寸 (2D) 缩放要素大小

具有逼真 3D 符号的主题可视化
具有逼真 3D 符号的主题可视化