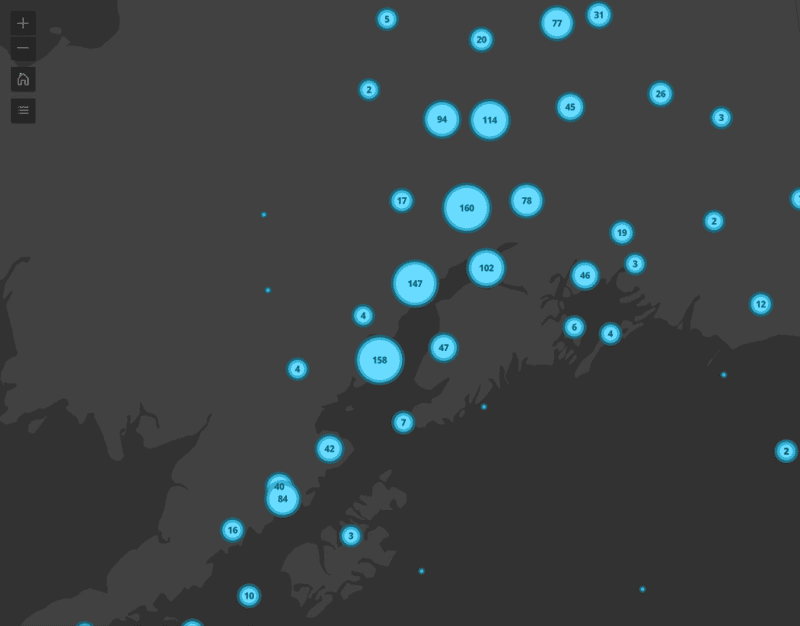
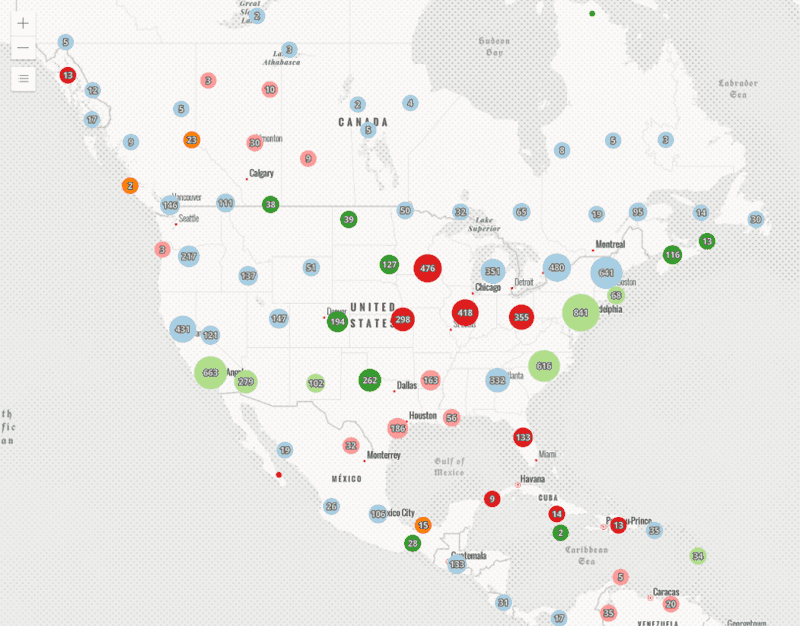
1
2
3
4
5
6
7
8
9
10
11
12
13
14
15
16
17
18
19
20
21
22
23
24
25
26
27
28
29
30
31
// Inform the popup, which fields the expression expects to use// to ensure they are downloaded to the clientExpects($aggregatedFeatures, "fuel1", "capacity_mw")
// Get the total number of features in the cluster// grouped by type and store it in a num_features fieldvar statsFS = GroupBy($aggregatedFeatures,
[
{ name: 'Type', expression: 'fuel1'},
],
[
{ name: 'num_features', expression: '1', statistic: 'COUNT' }
]
);
// Only return the top 5 results ordered by total featuresvar ordered = Top(OrderBy(statsFs, 'num_features DESC'), 5);
// create an HTML ordered list as a stringvar list = "<ol>";
// Create a new list item for each type in the top 5 'ordered' featuresetfor (var group in ordered){
list += \`<li>\${group.Type} (\${Text(group.num_features, "#,###")})</li>\`
}
list += "</ol>";
// return the list as rich text
return {
type: "text",
text: list
}
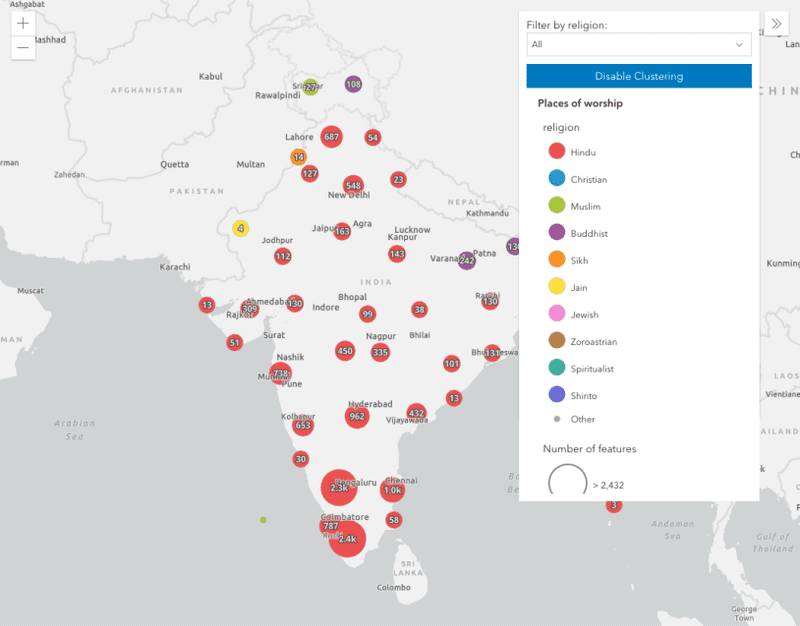
1
2
3
4
5
6
7
8
9
10
11
12
13
14
15
16
17
18
19
20
21
22
23
24
25
26
27
28
29
30
31
32
33
34
35
36
37
38
39
40
41
42
43
44
45
46
47
48
49
50
51
52
53
54
55
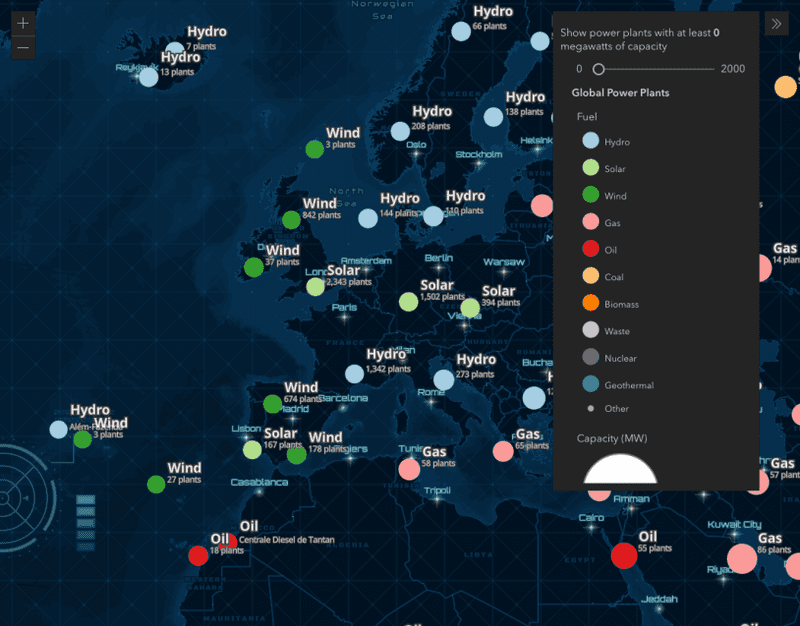
// Inform the popup, which fields the expression expects to use// to ensure they are downloaded to the clientExpects($aggregatedFeatures, "fuel1", "capacity_mw");
// create an object to store attributes// and arrays used to store field names for each chartvar attributes = {};
var countFieldNames = [];
var capacityFieldNames = [];
// Get the distinct types of fuel within the cluster.// This can be an array of 1-12 types depending on the cluster.var types = Distinct($aggregatedFeatures, "fuel1");
// add attributes to the dictionary for each type// one for the total count, the other for capacityfor(var t in types){
var type = t.fuel1;
// contains all the features belonging to the type// on this iteration of the loopvar filtered = Filter($aggregatedFeatures, "fuel1 = @type");
// Create a field name for the count of the current typevar countFieldName = type + " count";
// Store the total number of features in the attribute attributes[countFieldName] = Count(filtered);
// Push the fieldName to the appropriate array Push(countFieldNames, countFieldName);
// Repeat this process for the second chartvar capacityFieldName = type + " capacity (mW)";
// Instead of count, get the sum for the capacity and add to attributes attributes[capacityFieldName] = DefaultValue(Sum(filtered, "capacity_mw"), 0);
Push(capacityFieldNames, capacityFieldName);
}
return {
type: "media",
// attributes for both charts here attributes: attributes,
title: "Count vs. capacity comparison",
// list keys for attributes for each chart in "value" mediaInfos: [{
type: "piechart",
title: "Total count",
value: {
fields: countFieldNames
}
}, {
type: "piechart",
title: "Total capacity (mW)",
value: {
fields: capacityFieldNames
}
}]
}