按燃料类型对全球发电厂进行聚类和分类。聚类汇总了图层的渲染器,因此您可以一目了然地查看要素的空间密度。
什么是聚类?
聚类是一种通过彼此之间的空间接近度将点要素分组为聚类来减少图层中点的方法。通常,聚类按每个聚类中的要素数按比例调整大小。
如果区域中的许多点相互叠加,则这是显示该区域的有效方法。
聚类允许您有效地可视化点叠加在另一点上或彼此非常接近的位置。使用上面的卷帘微件比较发电厂的未聚类图层与聚类版本。
为什么聚类分析很有用?
大型点图层可能具有欺骗性。看起来只有几个点,但实际上可能是几千个。聚类允许您在相对较小的区域中以可视化方式表示大量点。
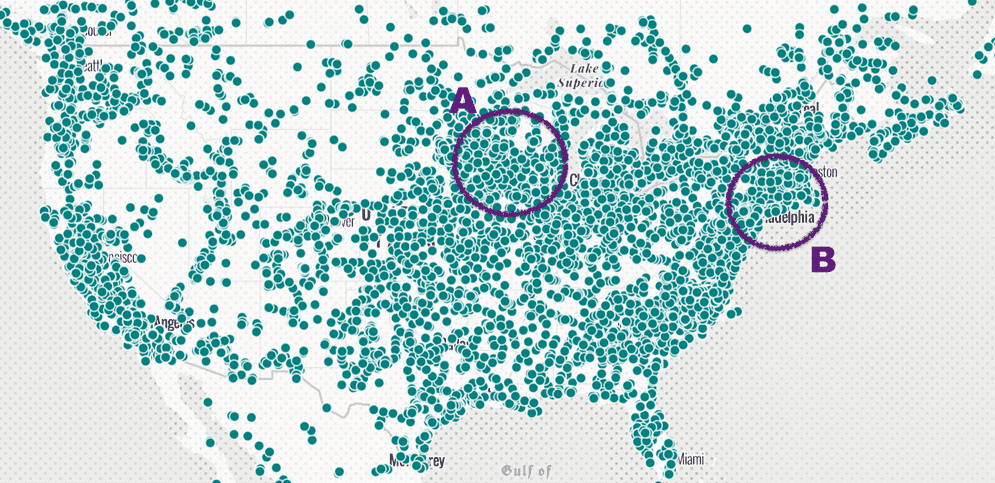
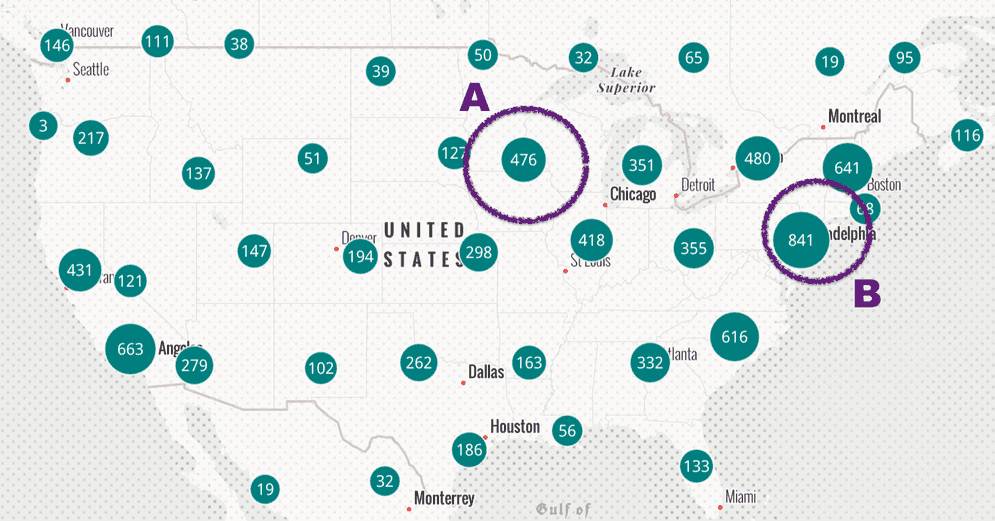
例如,以下地图显示了数千个发电厂的位置。在下图中,区域 A 和 B 都具有高密度的点,因此无法进行比较。

区域 A 和区域 B 都具有高密度的点。无法判断每个区域中有多少个点重叠。但是,启用聚类时,用户现在可以清楚地看到区域 B 的点数几乎是区域 A 的两倍。

聚类可使用户能够一目了然地轻松比较重叠要素的密度。聚类的工作方式
聚类是在图层的 featureReduction 属性上配置的。通过将 featureReduction 类型设置为 cluster,可以使用最少的代码启用聚类。
1
2
3
layer.featureReduction = {
  type: "cluster"
};
featureReduction 属性使您可以控制许多其他聚类属性。clusterRadius 可定义每个聚类的影响区域以包括要素。您还可以为聚类定义 popupTemplates 和 labels,以汇总聚类中包含的要素。
示例
基本聚类
以下示例演示了如何在点图层上启用聚类,以及如何配置用于显示聚类计数的标注和弹出窗口。
在图层上启用聚类后,将生成聚类使用的聚合字段。默认情况下,所有聚类图层都具有 cluster_count 聚合字段。这可用于每个聚类的标注和弹出窗口。图层渲染器中使用的其他字段均可以在弹出窗口中显示。您可在 FeatureReductionCluster.popupTemplate 文档中了解有关如何使用它们的更多信息。
Clusters recalculate at each zoom level. Summary information can be displayed in labels and the popup.
按计数聚类的全球发电厂。
52
52
52
52
52
52
52
52
52
52
52
52
52
52
52
52
52
52
52
52
52
52
52
52
52
52
52
52
52
52
52
52
52
52
52
52
52
52
52
52
52
52
52
52
52
52
52
52
52
52
52
52
53
54
55
56
57
58
59
60
61
62
63
64
65
66
67
68
69
70
71
72
73
74
75
76
77
78
79
80
81
82
83
84
85
86
86
86
86
86
86
86
86
86
86
86
86
86
86
86
86
86
86
86
86
86
86
86
86
86
86
86
86
86
86
86
86
86
86
86
86
86
86
86
86
86
86
86
86
86
1
2
3
4
5
6
7
8
9
10
11
12
13
14
15
16
17
18
19
20
21
22
23
24
25
26
27
28
29
30
31
32
33
34
35
36
37
38
39
40
41
42
43
44
45
46
47
48
49
50
51
52
53
54
55
56
57
58
59
60
61
62
63
64
65
66
67
68
69
70
71
72
73
74
75
76
77
78
79
80
81
82
83
84
85
86
87
88
89
90
91
92
93
94
95
96
97
98
99
100
101
102
103
104
105
106
107
108
109
110
111
112
113
114
115
116
117
118
119
120
121
122
123
124
125
126
127
128
129
130
<html>
  <head>
    <meta charset="utf-8" />
    <meta name="viewport" content="initial-scale=1,maximum-scale=1,user-scalable=no" />

    <title>Point clustering - basic configuration</title>

    <link rel="stylesheet" href="https://js.geoscene.cn/4.23/geoscene/themes/light/main.css" />
    <script src="https://js.geoscene.cn/4.23/"></script>

    <style>
      html,
      body,
      #viewDiv {
        height: 100%;
        width: 100%;
        margin: 0;
        padding: 0;
        background-color: white;
      }
    </style>

    <script>
      require([
        "geoscene/WebMap",
        "geoscene/views/MapView",
        "geoscene/layers/FeatureLayer"
      ], (
        WebMap,
        MapView,
        FeatureLayer
      ) => {

        const clusteredLayer = new FeatureLayer({
          portalItem: {
            id: "eb54b44c65b846cca12914b87b315169"
          },
          renderer: {
            type: "simple",
            symbol: {
              type: "simple-marker",
              size: 6,
              color: "teal",
              outline: {
                color: "white",
                width: 0.5
              }
            }
          }
        });


        clusteredLayer.featureReduction = {
          type: "cluster",
          clusterMinSize: 16.5,
          // defines the label within each cluster
          labelingInfo: [
            {
              deconflictionStrategy: "none",
              labelExpressionInfo: {
                expression: "Text($feature.cluster_count, '#,###')"
              },
              symbol: {
                type: "text",
                color: "white",
                font: {
                  family: "Noto Sans",
                  size: "12px"
                }
              },
              labelPlacement: "center-center"
            }
          ],
          // information to display when the user clicks a cluster
          popupTemplate: {
            title: "Cluster Summary",
            content: "This cluster represents <b>{cluster_count}</b> features.",
            fieldInfos: [{
              fieldName: "cluster_count",
              format: {
                places: 0,
                digitSeparator: true
              }
            }]
          }
        };


        const map = new WebMap({
          basemap: {
            portalItem: {
              id: "75a08e8cd8b64dcfa6945bb7f624ccc5"
            }
          },
          layers: [clusteredLayer]
        });

        const view = new MapView({
          container: "viewDiv",
          map,
          extent: {
            spatialReference: {
              latestWkid: 3857,
              wkid: 102100
            },
            xmin: -15327459,
            ymin: 2740044,
            xmax: -6076744,
            ymax: 6878650
          },
          popup: {
            dockEnabled: true,
            dockOptions: {
              breakpoint: false,
              position: "top-right"
            }
          },
          constraints: {
            snapToZoom: false
          }
        });

      });
    </script>
  </head>

  <body>
    <div id="viewDiv"></div>
  </body>
</html>
建议的聚类默认值
默认情况下,聚类符号始终汇总聚类中的要素。当图层具有 UniqueValueRenderer 时,每个聚类的符号表示聚类中要素的主要值。当图层应用了任何视觉变量时,可将聚类中每个变量的平均值应用于聚类符号。描述数值字段的主要类型和平均值的字段可以在聚类弹出窗口和标注中引用。
此示例使用智能制图方法演示了如何生成特定于图层渲染器的建议聚类配置。
按燃料类型对全球发电厂进行聚类和分类。聚类汇总了图层渲染器,因此您可以一目了然地查看聚类所包含的要素汇总。
102
102
102
102
102
102
102
102
102
102
102
102
102
102
102
102
102
102
102
102
102
102
102
102
102
102
102
102
102
102
102
102
102
102
102
102
102
102
102
102
102
102
102
102
102
102
102
102
102
102
102
102
102
102
102
102
102
102
102
102
102
102
102
102
102
102
102
102
102
102
102
102
102
102
102
102
102
102
102
102
102
102
102
102
102
102
102
102
102
102
102
102
102
102
102
102
102
102
102
102
102
102
103
104
105
106
107
108
109
110
111
112
113
114
115
116
117
118
119
120
121
122
122
122
122
122
122
122
122
122
122
122
122
1
2
3
4
5
6
7
8
9
10
11
12
13
14
15
16
17
18
19
20
21
22
23
24
25
26
27
28
29
30
31
32
33
34
35
36
37
38
39
40
41
42
43
44
45
46
47
48
49
50
51
52
53
54
55
56
57
58
59
60
61
62
63
64
65
66
67
68
69
70
71
72
73
74
75
76
77
78
79
80
81
82
83
84
85
86
87
88
89
90
91
92
93
94
95
96
97
98
99
100
101
102
103
104
105
106
107
108
109
110
111
112
113
114
115
116
117
118
119
120
121
122
123
124
125
126
127
128
129
130
131
132
133
<html>
  <head>
    <meta charset="utf-8" />
    <meta name="viewport" content="initial-scale=1,maximum-scale=1,user-scalable=no" />

    <title> Point clustering - unique values</title>

    <link rel="stylesheet" href="https://js.geoscene.cn/4.23/geoscene/themes/light/main.css" />
    <script src="https://js.geoscene.cn/4.23/"></script>

    <style>
      html,
      body,
      #viewDiv {
        height: 100%;
        width: 100%;
        margin: 0;
        padding: 0;
        background-color: white;
      }
    </style>

    <script>
      require([
        "geoscene/WebMap",
        "geoscene/views/MapView",
        "geoscene/layers/FeatureLayer",
        "geoscene/widgets/Legend",
        "geoscene/widgets/Expand",
        "geoscene/smartMapping/labels/clusters",
        "geoscene/smartMapping/popup/clusters"
      ], (
        WebMap,
        MapView,
        FeatureLayer,
        Legend,
        Expand,
        clusterLabelCreator,
        clusterPopupCreator
      ) => {

        const layer = new FeatureLayer({
          portalItem: {
            id: "eb54b44c65b846cca12914b87b315169"
          }
        });

        const map = new WebMap({
          basemap: {
            portalItem: {
              id: "75a08e8cd8b64dcfa6945bb7f624ccc5"
            }
          },
          layers: [layer]
        });

        const view = new MapView({
          container: "viewDiv",
          map,
          extent: {
            spatialReference: {
              latestWkid: 3857,
              wkid: 102100
            },
            xmin: -15327459,
            ymin: 2740044,
            xmax: -6076744,
            ymax: 6878650
          },
          popup: {
            dockEnabled: true,
            dockOptions: {
              breakpoint: false,
              position: "top-right"
            }
          },
          constraints: {
            snapToZoom: false
          }
        });

        view.ui.add(
          new Expand({
            content: new Legend({ view }),
            view
          }),
          "top-left"
        );

        layer
          .when()
          .then(generateClusterConfig)
          .then( (featureReduction) => {
            // sets generated cluster configuration on the layer
            layer.featureReduction = featureReduction;
          })
          .catch((error) => {
            console.error(error);
          });

        async function generateClusterConfig(layer) {

          // generates default popupTemplate
          const popupTemplate = await clusterPopupCreator
            .getTemplates({ layer })
            .then( (popupTemplateResponse) => popupTemplateResponse.primaryTemplate.value );

          // generates default labelingInfo
          const { labelingInfo, clusterMinSize } = await clusterLabelCreator
            .getLabelSchemes({
              layer,
              view
            })
            .then((labelSchemes) => labelSchemes.primaryScheme);

          // Set this object on layer.featureReduction
          return {
            type: "cluster",
            popupTemplate,
            labelingInfo,
            clusterMinSize
          };

        }

      });
    </script>
  </head>

  <body>
    <div id="viewDiv"></div>
  </body>
</html>
API 支持
下表描述了非常适合每种可视化技术的几何和视图类型。
完全支持部分支持不支持
