点聚类 - 查询聚类
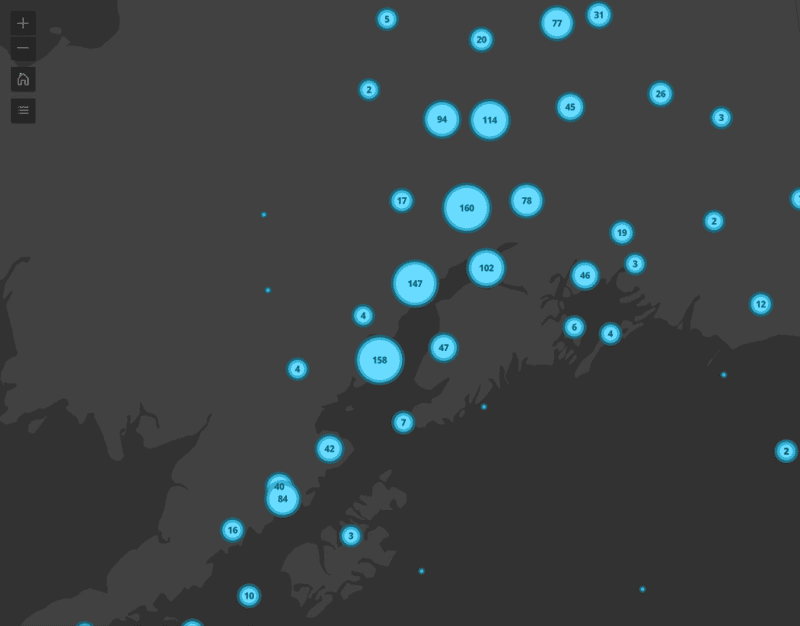
此示例演示如何查询由聚合点聚类表示的要素。聚类是一种减少 FeatureLayer、CSVLayer、GeoJSONLayer、WFSLayer 或 OGCFeatureLayer 中的点的方法,方法是根据它们之间的空间接近程度对它们进行分组。 通常,聚类的大小取决于每个聚类中的要素数。如果您不熟悉聚类,请参阅点聚类 - 基本配置示例。
通过查询聚类要素,您可以执行以下操作:
- 在弹出窗口中查询并显示描述聚类要素的统计数据。
- 查询要素的范围并将其显示在视图中。
- 查询所有要素并计算凸壳。
要查询聚类的要素,必须将表示聚类的图形的 ObjectID 提供给 Query.aggregateIds 属性,并将参数传递给聚类图层的图层视图上的所需查询方法。
查询聚类要素
1
2
3
4
5
6
7
8
9
10
11
12
13
14
15
16
17
18
19
20
21
22
23
24
25
26
27
28
29
30
31
32
33
34
35
36
37
38
39
40
41
42
43
44
45
46
47
48
49
50
51
52
53
54
55
56
57
58
59
60
61
62
63
64
65
66
67
68
69
70
71
72
73
74
75
76
77
78
79
80
81
82
83
84
85
86
87
88
89
90
91
92
93
94
95
96
97
98
99
100
101
102
103
104
105
106
107
108
109
110
111
112
113
114
115
116
117
118
119
120
121
122
123
124
125
126
127
128
129
130
131
132
133
134
135
136
137
138
139
140
141
142
143
144
145
146
147
148
149
150
151
152
153
154
155
156
157
158
159
160
161
162
163
164
165
166
167
168
169
170
171
172
173
174
175
176
177
178
179
180
181
182
183
184
185
186
187
188
189
190
191
192
193
194
195
196
197
198
199
200
201
202
203
204
205
206
207
208
209
210
211
212
213
214
215
216
217
218
219
220
221
222
223
224
225
226
227
228
229
230
231
232
233
234
235
236
237
238
239
240
241
242
243
244
245
246
247
248
249
250
251
252
253
254
255
256
257
258
259
260
261
262
263
264
265
266
267
268
269
270
271
272
273
274
275
276
277
278
279
280
281
282
283
284
285
286
287
288
289
290
291
292
293
294
295
296
297
298
299
300
301
302
303
304
305
306
307
308
309
310
311
312
313
314
315
316
317
318
319
320
321
322
323
324
325
326
327
328
329
330
331
332
333
334
335
336
337
338
339
340
341
342
343
344
345
346
347
348
349
350
351
352
353
354
355
356
357
358
<!DOCTYPE html>
<html>
<head>
<meta charset="utf-8" />
<meta
name="viewport"
content="initial-scale=1,maximum-scale=1,user-scalable=no"
/>
<title>Point clustering - query clusters | Sample | GeoScene API for JavaScript 4.22</title>
<link rel="stylesheet" href="https://js.geoscene.cn/4.23/geoscene/themes/light/main.css" />
<script src="https://js.geoscene.cn/4.23/"></script>
<style>
html,
body,
#viewDiv {
height: 100%;
width: 100%;
margin: 0;
padding: 0;
background-color: white;
}
#infoDiv {
background: white;
padding: 10px;
}
table td {
padding: 3px;
}
table.popup td.num {
text-align: right;
}
table.popup tr.head {
text-align: center;
font-weight: bold;
background-color:rgba(50, 50, 50,0.08);
}
.table-container {
width:100%;
height:100%;
text-align: center;
}
table {
margin: 0 auto;
}
</style>
<script>
require([
"geoscene/WebMap",
"geoscene/Graphic",
"geoscene/views/MapView",
"geoscene/layers/FeatureLayer",
"geoscene/widgets/Legend",
"geoscene/widgets/Expand",
"geoscene/smartMapping/labels/clusters",
"geoscene/smartMapping/popup/clusters",
"geoscene/core/watchUtils",
"geoscene/symbols/support/symbolUtils",
"geoscene/geometry/geometryEngine",
], (
WebMap,
Graphic,
MapView,
FeatureLayer,
Legend,
Expand,
clusterLabelCreator,
clusterPopupCreator,
watchUtils,
symbolUtils,
geometryEngine
) => {
let layerView;
const layer = new FeatureLayer({
portalItem: {
id: "eb54b44c65b846cca12914b87b315169"
},
outFields: [ "capacity_mw" ]
});
const map = new WebMap({
basemap: {
portalItem: {
id: "75a08e8cd8b64dcfa6945bb7f624ccc5"
}
},
layers: [ layer ]
});
const view = new MapView({
container: "viewDiv",
map,
extent: {
spatialReference: {
latestWkid: 3857,
wkid: 102100
},
xmin: -15327459,
ymin: 2740044,
xmax: -6076744,
ymax: 6878650
},
popup: {
dockEnabled: true,
dockOptions: {
breakpoint: false,
position: "top-right"
}
}
});
view.ui.add( new Expand({
content: new Legend({ view }),
view
}), "top-left");
layer
.when()
.then(generateClusterConfig)
.then( async (featureReduction) => {
// sets generated cluster configuration on the layer
layer.featureReduction = featureReduction;
// the layer view is needed for querying clusters
layerView = await view.whenLayerView(layer);
// Disable clustering when user zooms beyond a 1:50,000 scale level
// Re-enable clustering when the user zooms out to a scale smaller than 1:50,000
view.watch("scale", (scale) => {
layer.featureReduction = view.scale > 50000 ? featureReduction : null;
});
})
.catch((error) => {
console.error(error);
});
async function generateClusterConfig(layer) {
// generates default popupTemplate
const popupTemplate =
await clusterPopupCreator
.getTemplates({
layer
})
.then((popupTemplateResponse) => popupTemplateResponse.primaryTemplate.value);
// Add actions for exploring the features of each cluster
popupTemplate.actions = [
{
title: "Statistics",
id: "statistics",
className: "esri-icon-line-chart"
},
{
title: "Convex hull",
id: "convex-hull",
className: "esri-icon-polygon"
},
{
title: "Show features",
id: "show-features",
className: "esri-icon-maps"
}
];
// generates default labelingInfo
const { labelingInfo, clusterMinSize } =
await clusterLabelCreator
.getLabelSchemes({
layer, view
})
.then((labelSchemes) => labelSchemes.primaryScheme);
return {
type: "cluster",
popupTemplate,
labelingInfo,
clusterMinSize
};
}
view.popup.on("trigger-action", (event) => {
clearViewGraphics();
const popup = view.popup;
const selectedFeature = popup.selectedFeature && popup.selectedFeature.isAggregate
const id = event.action.id;
if(id === "convex-hull"){
displayConvexHull(view.popup.selectedFeature);
}
if(id === "show-features"){
displayFeatures(view.popup.selectedFeature);
}
if(id === "statistics"){
calculateStatistics(view.popup.selectedFeature);
}
});
watchUtils.watch(view, ["scale", "popup.selectedFeature", "popup.visible"], clearViewGraphics);
let convexHullGraphic = null;
let clusterChildGraphics = [];
function clearViewGraphics(){
view.graphics.remove(convexHullGraphic);
view.graphics.removeMany(clusterChildGraphics);
}
// displays all features from a given cluster in the view
async function displayFeatures(graphic){
processParams(graphic, layerView);
const query = layerView.createQuery();
query.aggregateIds = [graphic.getObjectId()];
const { features } = await layerView.queryFeatures(query);
features.forEach( async (feature) => {
const symbol = await symbolUtils.getDisplayedSymbol(feature)
feature.symbol = symbol;
view.graphics.add(feature);
});
clusterChildGraphics = features;
}
async function displayConvexHull(graphic){
processParams(graphic, layerView);
const query = layerView.createQuery();
query.aggregateIds = [graphic.getObjectId()];
const { features } = await layerView.queryFeatures(query);
const geometries = features.map( feature => feature.geometry );
const [ convexHull ] = geometryEngine.convexHull(geometries, true);
convexHullGraphic = new Graphic({
geometry: convexHull,
symbol: {
type: "simple-fill",
outline: {
width: 1.5,
color: [ 75, 75, 75, 1 ]
},
style: "none",
color: [ 0, 0, 0, 0.1 ]
}
});
view.graphics.add(convexHullGraphic);
}
// calculates set statistics for features in a cluster
// and displays them in the cluster popup
async function calculateStatistics(graphic){
processParams(graphic, layerView);
const query = layerView.createQuery();
query.aggregateIds = [graphic.getObjectId()];
query.groupByFieldsForStatistics = [ "fuel1" ];
query.outFields = [ "capacity_mw", "fuel1" ];
query.orderByFields = [ "num_features desc" ];
query.outStatistics = [
{
onStatisticField: "capacity_mw",
outStatisticFieldName: "capacity_total",
statisticType: "sum"
},
{
onStatisticField: "1",
outStatisticFieldName: "num_features",
statisticType: "count"
},
{
onStatisticField: "capacity_mw",
outStatisticFieldName: "capacity_max",
statisticType: "max"
}
];
const { features } = await layerView.queryFeatures(query);
const stats = features.map( feature => feature.attributes);
let table = `
<div class="table-container">
<span style="font-size: 14pt"><strong>Summary by fuel type</strong></span>
<br/>
<br/>
<table class="esri-widget popup">
<tr class="head"><td>Fuel</td><td>Count</td><td>Capacity (mW)</td><td>Largest plant (mW)</td></tr>
`;
let totalCapacity = 0;
let totalCount = 0;
stats.forEach( stat => {
const fuel = stat.fuel1;
const total = stat.capacity_total;
const max = stat.capacity_max;
const count = stat.num_features;
totalCapacity += total;
totalCount += count;
table += `
<tr><td><span style:'font-weight:bolder'>${fuel}</span></td><td class="num">${count}</td><td class="num">${roundDecimals(total, 2).toLocaleString()}</td><td class="num">${roundDecimals(max, 2).toLocaleString()}</td></tr>
`;
});
table += `
</table>
</div>`;
view.popup.content = `
<div style="font-size: 12pt">
Number of features: <strong>${totalCount.toLocaleString()}</strong><br>
Total capacity (mW): <strong>${roundDecimals(totalCapacity, 2).toLocaleString()}</strong><br>
</div><br>
` + table;
}
function processParams(graphic, layerView){
if (!graphic || !layerView) {
throw new Error("Graphic or layerView not provided.");
}
if (!graphic.isAggregate) {
throw new Error("Graphic must represent a cluster.");
}
}
function roundDecimals(num, places){
return Math.round(num * Math.pow(10, places)) / Math.pow(10, places);
}
});
</script>
</head>
<body>
<div id="viewDiv"></div>
</body>
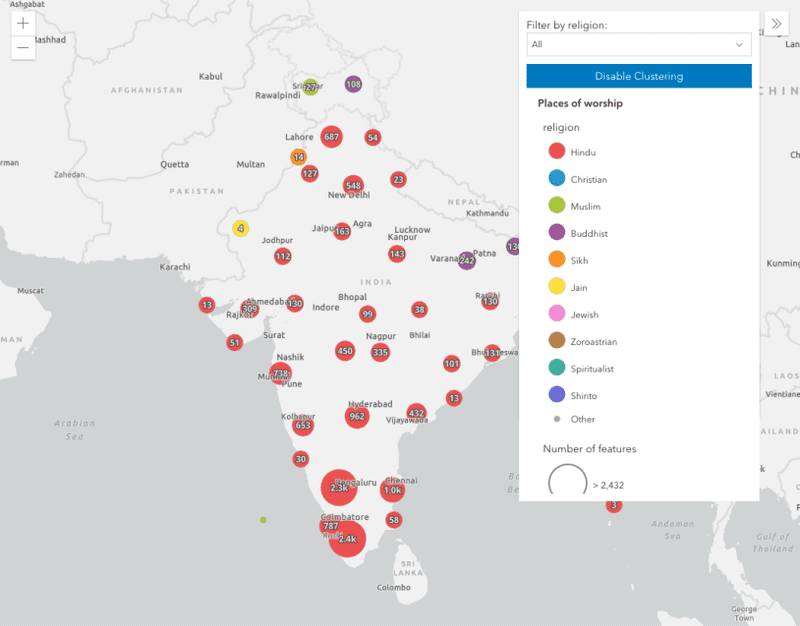
</html>查询聚类统计数据
要查询聚类中包含的要素的统计数据,请在 Query.aggregateIds 中引用聚类图形的 ObjectID,然后指定查询 outStatistics。由于聚类图层具有 UniqueValueRenderer,因此我们将使用 groupByFieldsForStatistics 按用于对渲染器中的要素进行分类的字段对统计数据进行分组。

计算聚类统计信息
269
269
269
269
269
269
269
269
269
269
269
269
269
269
269
269
269
269
269
269
269
269
269
269
269
269
269
269
269
269
269
269
269
269
269
269
269
269
269
269
269
269
269
269
269
269
269
269
269
269
269
269
269
269
269
269
269
269
269
269
269
269
269
269
269
269
269
269
269
269
269
269
269
269
269
269
269
269
269
269
269
269
269
269
269
269
269
269
269
269
269
269
269
269
269
269
269
269
269
269
269
269
269
269
269
269
269
269
269
269
269
269
269
269
269
269
269
269
269
269
269
269
269
269
269
269
269
269
269
269
269
269
269
269
269
269
269
269
269
269
269
269
269
269
269
269
269
269
269
269
269
269
269
269
269
269
269
269
269
269
269
269
269
269
269
269
269
269
269
269
269
269
269
269
269
269
269
269
269
269
269
269
269
269
269
269
269
269
269
269
269
269
269
269
269
269
269
269
269
269
269
269
269
269
269
269
269
269
269
269
269
269
269
269
269
269
269
269
269
269
269
269
269
269
269
269
269
269
269
269
269
269
269
269
269
269
269
269
269
269
269
269
269
269
269
269
269
269
269
269
269
269
269
269
269
269
269
269
269
269
269
269
269
269
269
269
269
269
269
270
271
272
273
274
275
276
277
278
279
280
281
282
283
284
285
286
287
288
289
290
291
292
293
294
295
296
296
296
296
296
296
296
296
296
296
296
296
296
296
296
296
296
296
296
296
296
296
296
296
296
296
296
296
296
296
296
296
296
296
296
296
296
296
296
296
296
296
296
296
296
296
296
296
296
296
296
296
296
296
296
296
296
296
296
296
296
296
296
1
2
3
4
5
6
7
8
9
10
11
12
13
14
15
16
17
18
19
20
21
22
23
24
25
26
27
28
29
30
31
32
33
34
35
36
37
38
39
40
41
42
43
44
45
46
47
48
49
50
51
52
53
54
55
56
57
58
59
60
61
62
63
64
65
66
67
68
69
70
71
72
73
74
75
76
77
78
79
80
81
82
83
84
85
86
87
88
89
90
91
92
93
94
95
96
97
98
99
100
101
102
103
104
105
106
107
108
109
110
111
112
113
114
115
116
117
118
119
120
121
122
123
124
125
126
127
128
129
130
131
132
133
134
135
136
137
138
139
140
141
142
143
144
145
146
147
148
149
150
151
152
153
154
155
156
157
158
159
160
161
162
163
164
165
166
167
168
169
170
171
172
173
174
175
176
177
178
179
180
181
182
183
184
185
186
187
188
189
190
191
192
193
194
195
196
197
198
199
200
201
202
203
204
205
206
207
208
209
210
211
212
213
214
215
216
217
218
219
220
221
222
223
224
225
226
227
228
229
230
231
232
233
234
235
236
237
238
239
240
241
242
243
244
245
246
247
248
249
250
251
252
253
254
255
256
257
258
259
260
261
262
263
264
265
266
267
268
269
270
271
272
273
274
275
276
277
278
279
280
281
282
283
284
285
286
287
288
289
290
291
292
293
294
295
296
297
298
299
300
301
302
303
304
305
306
307
308
309
310
311
312
313
314
315
316
317
318
319
320
321
322
323
324
325
326
327
328
329
330
331
332
333
334
335
336
337
338
339
340
341
342
343
344
345
346
347
348
349
350
351
352
353
354
355
356
357
358
<!DOCTYPE html>
<html>
<head>
<meta charset="utf-8" />
<meta
name="viewport"
content="initial-scale=1,maximum-scale=1,user-scalable=no"
/>
<title>Point clustering - query clusters | Sample | GeoScene API for JavaScript 4.22</title>
<link rel="stylesheet" href="https://js.geoscene.cn/4.23/geoscene/themes/light/main.css" />
<script src="https://js.geoscene.cn/4.23/"></script>
<style>
html,
body,
#viewDiv {
height: 100%;
width: 100%;
margin: 0;
padding: 0;
background-color: white;
}
#infoDiv {
background: white;
padding: 10px;
}
table td {
padding: 3px;
}
table.popup td.num {
text-align: right;
}
table.popup tr.head {
text-align: center;
font-weight: bold;
background-color:rgba(50, 50, 50,0.08);
}
.table-container {
width:100%;
height:100%;
text-align: center;
}
table {
margin: 0 auto;
}
</style>
<script>
require([
"geoscene/WebMap",
"geoscene/Graphic",
"geoscene/views/MapView",
"geoscene/layers/FeatureLayer",
"geoscene/widgets/Legend",
"geoscene/widgets/Expand",
"geoscene/smartMapping/labels/clusters",
"geoscene/smartMapping/popup/clusters",
"geoscene/core/watchUtils",
"geoscene/symbols/support/symbolUtils",
"geoscene/geometry/geometryEngine",
], (
WebMap,
Graphic,
MapView,
FeatureLayer,
Legend,
Expand,
clusterLabelCreator,
clusterPopupCreator,
watchUtils,
symbolUtils,
geometryEngine
) => {
let layerView;
const layer = new FeatureLayer({
portalItem: {
id: "eb54b44c65b846cca12914b87b315169"
},
outFields: [ "capacity_mw" ]
});
const map = new WebMap({
basemap: {
portalItem: {
id: "75a08e8cd8b64dcfa6945bb7f624ccc5"
}
},
layers: [ layer ]
});
const view = new MapView({
container: "viewDiv",
map,
extent: {
spatialReference: {
latestWkid: 3857,
wkid: 102100
},
xmin: -15327459,
ymin: 2740044,
xmax: -6076744,
ymax: 6878650
},
popup: {
dockEnabled: true,
dockOptions: {
breakpoint: false,
position: "top-right"
}
}
});
view.ui.add( new Expand({
content: new Legend({ view }),
view
}), "top-left");
layer
.when()
.then(generateClusterConfig)
.then( async (featureReduction) => {
// sets generated cluster configuration on the layer
layer.featureReduction = featureReduction;
// the layer view is needed for querying clusters
layerView = await view.whenLayerView(layer);
// Disable clustering when user zooms beyond a 1:50,000 scale level
// Re-enable clustering when the user zooms out to a scale smaller than 1:50,000
view.watch("scale", (scale) => {
layer.featureReduction = view.scale > 50000 ? featureReduction : null;
});
})
.catch((error) => {
console.error(error);
});
async function generateClusterConfig(layer) {
// generates default popupTemplate
const popupTemplate =
await clusterPopupCreator
.getTemplates({
layer
})
.then((popupTemplateResponse) => popupTemplateResponse.primaryTemplate.value);
// Add actions for exploring the features of each cluster
popupTemplate.actions = [
{
title: "Statistics",
id: "statistics",
className: "esri-icon-line-chart"
},
{
title: "Convex hull",
id: "convex-hull",
className: "esri-icon-polygon"
},
{
title: "Show features",
id: "show-features",
className: "esri-icon-maps"
}
];
// generates default labelingInfo
const { labelingInfo, clusterMinSize } =
await clusterLabelCreator
.getLabelSchemes({
layer, view
})
.then((labelSchemes) => labelSchemes.primaryScheme);
return {
type: "cluster",
popupTemplate,
labelingInfo,
clusterMinSize
};
}
view.popup.on("trigger-action", (event) => {
clearViewGraphics();
const popup = view.popup;
const selectedFeature = popup.selectedFeature && popup.selectedFeature.isAggregate
const id = event.action.id;
if(id === "convex-hull"){
displayConvexHull(view.popup.selectedFeature);
}
if(id === "show-features"){
displayFeatures(view.popup.selectedFeature);
}
if(id === "statistics"){
calculateStatistics(view.popup.selectedFeature);
}
});
watchUtils.watch(view, ["scale", "popup.selectedFeature", "popup.visible"], clearViewGraphics);
let convexHullGraphic = null;
let clusterChildGraphics = [];
function clearViewGraphics(){
view.graphics.remove(convexHullGraphic);
view.graphics.removeMany(clusterChildGraphics);
}
// displays all features from a given cluster in the view
async function displayFeatures(graphic){
processParams(graphic, layerView);
const query = layerView.createQuery();
query.aggregateIds = [graphic.getObjectId()];
const { features } = await layerView.queryFeatures(query);
features.forEach( async (feature) => {
const symbol = await symbolUtils.getDisplayedSymbol(feature)
feature.symbol = symbol;
view.graphics.add(feature);
});
clusterChildGraphics = features;
}
async function displayConvexHull(graphic){
processParams(graphic, layerView);
const query = layerView.createQuery();
query.aggregateIds = [graphic.getObjectId()];
const { features } = await layerView.queryFeatures(query);
const geometries = features.map( feature => feature.geometry );
const [ convexHull ] = geometryEngine.convexHull(geometries, true);
convexHullGraphic = new Graphic({
geometry: convexHull,
symbol: {
type: "simple-fill",
outline: {
width: 1.5,
color: [ 75, 75, 75, 1 ]
},
style: "none",
color: [ 0, 0, 0, 0.1 ]
}
});
view.graphics.add(convexHullGraphic);
}
// calculates set statistics for features in a cluster
// and displays them in the cluster popup
async function calculateStatistics(graphic){
processParams(graphic, layerView);
const query = layerView.createQuery();
query.aggregateIds = [graphic.getObjectId()];
query.groupByFieldsForStatistics = [ "fuel1" ];
query.outFields = [ "capacity_mw", "fuel1" ];
query.orderByFields = [ "num_features desc" ];
query.outStatistics = [
{
onStatisticField: "capacity_mw",
outStatisticFieldName: "capacity_total",
statisticType: "sum"
},
{
onStatisticField: "1",
outStatisticFieldName: "num_features",
statisticType: "count"
},
{
onStatisticField: "capacity_mw",
outStatisticFieldName: "capacity_max",
statisticType: "max"
}
];
const { features } = await layerView.queryFeatures(query);
const stats = features.map( feature => feature.attributes);
let table = `
<div class="table-container">
<span style="font-size: 14pt"><strong>Summary by fuel type</strong></span>
<br/>
<br/>
<table class="esri-widget popup">
<tr class="head"><td>Fuel</td><td>Count</td><td>Capacity (mW)</td><td>Largest plant (mW)</td></tr>
`;
let totalCapacity = 0;
let totalCount = 0;
stats.forEach( stat => {
const fuel = stat.fuel1;
const total = stat.capacity_total;
const max = stat.capacity_max;
const count = stat.num_features;
totalCapacity += total;
totalCount += count;
table += `
<tr><td><span style:'font-weight:bolder'>${fuel}</span></td><td class="num">${count}</td><td class="num">${roundDecimals(total, 2).toLocaleString()}</td><td class="num">${roundDecimals(max, 2).toLocaleString()}</td></tr>
`;
});
table += `
</table>
</div>`;
view.popup.content = `
<div style="font-size: 12pt">
Number of features: <strong>${totalCount.toLocaleString()}</strong><br>
Total capacity (mW): <strong>${roundDecimals(totalCapacity, 2).toLocaleString()}</strong><br>
</div><br>
` + table;
}
function processParams(graphic, layerView){
if (!graphic || !layerView) {
throw new Error("Graphic or layerView not provided.");
}
if (!graphic.isAggregate) {
throw new Error("Graphic must represent a cluster.");
}
}
function roundDecimals(num, places){
return Math.round(num * Math.pow(10, places)) / Math.pow(10, places);
}
});
</script>
</head>
<body>
<div id="viewDiv"></div>
</body>
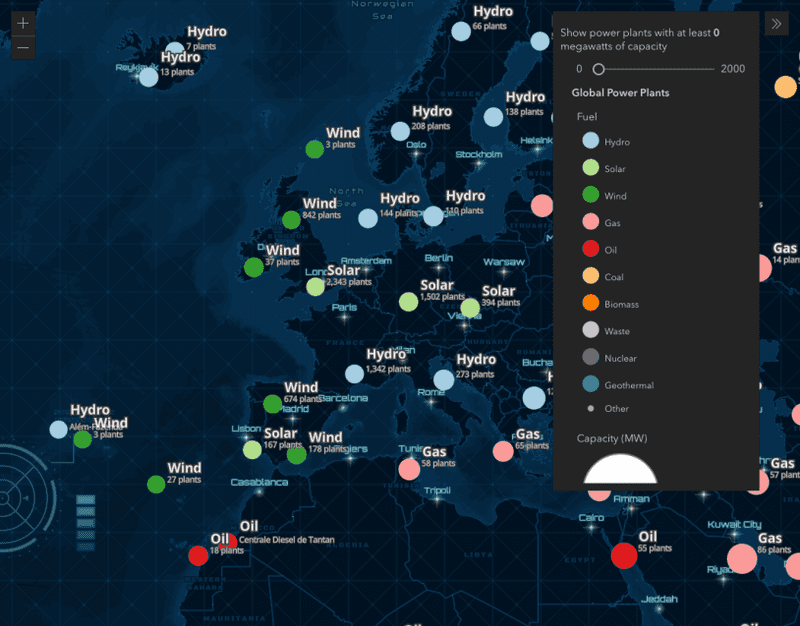
</html>查询聚类范围
您可能希望向用户显示聚类要素的范围。为此,请在 Query.aggregateIds 中引用聚类图形的 ObjectID,并在图层视图上调用 queryExtent 方法。

1
2
3
4
5
6
7
8
9
10
11
12
13
14
15
16
17
18
19
async function displayClusterExtent(graphic){
  const query = layerView.createQuery();
  query.aggregateIds = [ graphic.getObjectId() ];

  const { extent } = await layerView.queryExtent(query);
  const extentGraphic = {
    geometry: extent,
    symbol: {
      type: "simple-fill",
      outline: {
        width: 1.5,
        color: [ 75, 75, 75, 1 ]
      },
      style: "none",
      color: [ 0, 0, 0, 0.1 ]
    }
  };
  view.graphics.add(extentGraphic);
}
默认情况下,单击 browse features 操作时,聚类弹出窗口已显示聚类范围。
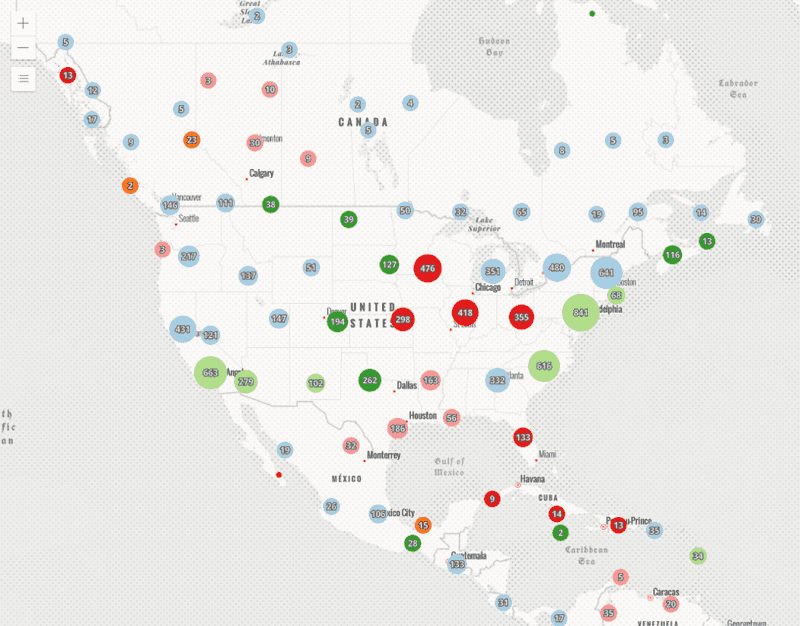
显示聚类凸壳
也许最好显示聚类要素的凸壳,而不是范围,因为它更准确地表示点的分布。geometryEngine 允许您执行此操作。查询聚类中的所有要素,获取其几何,然后将其传递到 geometryEngine 的 convexHull 方法。

显示聚类凸壳
238
238
238
238
238
238
238
238
238
238
238
238
238
238
238
238
238
238
238
238
238
238
238
238
238
238
238
238
238
238
238
238
238
238
238
238
238
238
238
238
238
238
238
238
238
238
238
238
238
238
238
238
238
238
238
238
238
238
238
238
238
238
238
238
238
238
238
238
238
238
238
238
238
238
238
238
238
238
238
238
238
238
238
238
238
238
238
238
238
238
238
238
238
238
238
238
238
238
238
238
238
238
238
238
238
238
238
238
238
238
238
238
238
238
238
238
238
238
238
238
238
238
238
238
238
238
238
238
238
238
238
238
238
238
238
238
238
238
238
238
238
238
238
238
238
238
238
238
238
238
238
238
238
238
238
238
238
238
238
238
238
238
238
238
238
238
238
238
238
238
238
238
238
238
238
238
238
238
238
238
238
238
238
238
238
238
238
238
238
238
238
238
238
238
238
238
238
238
238
238
238
238
238
238
238
238
238
238
238
238
238
238
238
238
238
238
238
238
238
238
238
238
238
238
238
238
238
238
238
238
238
238
238
238
238
238
238
238
239
240
241
242
243
244
245
246
247
248
249
250
251
252
253
254
255
256
257
258
259
260
261
261
261
261
261
261
261
261
261
261
261
261
261
261
261
261
261
261
261
261
261
261
261
261
261
261
261
261
261
261
261
261
261
261
261
261
261
261
261
261
261
261
261
261
261
261
261
261
261
261
261
261
261
261
261
261
261
261
261
261
261
261
261
261
261
261
261
261
261
261
261
261
261
261
261
261
261
261
261
261
261
261
261
261
261
261
261
261
261
261
261
261
261
261
261
261
261
261
1
2
3
4
5
6
7
8
9
10
11
12
13
14
15
16
17
18
19
20
21
22
23
24
25
26
27
28
29
30
31
32
33
34
35
36
37
38
39
40
41
42
43
44
45
46
47
48
49
50
51
52
53
54
55
56
57
58
59
60
61
62
63
64
65
66
67
68
69
70
71
72
73
74
75
76
77
78
79
80
81
82
83
84
85
86
87
88
89
90
91
92
93
94
95
96
97
98
99
100
101
102
103
104
105
106
107
108
109
110
111
112
113
114
115
116
117
118
119
120
121
122
123
124
125
126
127
128
129
130
131
132
133
134
135
136
137
138
139
140
141
142
143
144
145
146
147
148
149
150
151
152
153
154
155
156
157
158
159
160
161
162
163
164
165
166
167
168
169
170
171
172
173
174
175
176
177
178
179
180
181
182
183
184
185
186
187
188
189
190
191
192
193
194
195
196
197
198
199
200
201
202
203
204
205
206
207
208
209
210
211
212
213
214
215
216
217
218
219
220
221
222
223
224
225
226
227
228
229
230
231
232
233
234
235
236
237
238
239
240
241
242
243
244
245
246
247
248
249
250
251
252
253
254
255
256
257
258
259
260
261
262
263
264
265
266
267
268
269
270
271
272
273
274
275
276
277
278
279
280
281
282
283
284
285
286
287
288
289
290
291
292
293
294
295
296
297
298
299
300
301
302
303
304
305
306
307
308
309
310
311
312
313
314
315
316
317
318
319
320
321
322
323
324
325
326
327
328
329
330
331
332
333
334
335
336
337
338
339
340
341
342
343
344
345
346
347
348
349
350
351
352
353
354
355
356
357
358
<!DOCTYPE html>
<html>
<head>
<meta charset="utf-8" />
<meta
  name="viewport"
  content="initial-scale=1,maximum-scale=1,user-scalable=no"
/>

<title>Point clustering - query clusters | Sample | GeoScene API for JavaScript 4.22</title>

<link rel="stylesheet" href="https://js.geoscene.cn/4.23/geoscene/themes/light/main.css" />
<script src="https://js.geoscene.cn/4.23/"></script>

<style>
  html,
  body,
  #viewDiv {
    height: 100%;
    width: 100%;
    margin: 0;
    padding: 0;
    background-color: white;
  }
  #infoDiv {
    background: white;
    padding: 10px;
  }
  table td {
    padding: 3px;
  }

  table.popup td.num {
    text-align: right;
  }

  table.popup tr.head {
    text-align: center;
    font-weight: bold;
    background-color:rgba(50, 50, 50,0.08);
  }

  .table-container {
    width:100%;
    height:100%;
    text-align: center;
  }

  table {
    margin: 0 auto;
  }
</style>

<script>
  require([
    "geoscene/WebMap",
    "geoscene/Graphic",
    "geoscene/views/MapView",
    "geoscene/layers/FeatureLayer",
    "geoscene/widgets/Legend",
    "geoscene/widgets/Expand",
    "geoscene/smartMapping/labels/clusters",
    "geoscene/smartMapping/popup/clusters",
    "geoscene/core/watchUtils",
    "geoscene/symbols/support/symbolUtils",
    "geoscene/geometry/geometryEngine",
  ], (
    WebMap,
    Graphic,
    MapView,
    FeatureLayer,
    Legend,
    Expand,
    clusterLabelCreator,
    clusterPopupCreator,
    watchUtils,
    symbolUtils,
    geometryEngine
  ) => {

    let layerView;

    const layer = new FeatureLayer({
      portalItem: {
        id: "eb54b44c65b846cca12914b87b315169"
      },
      outFields: [ "capacity_mw" ]
    });

    const map = new WebMap({
      basemap: {
        portalItem: {
          id: "75a08e8cd8b64dcfa6945bb7f624ccc5"
        }
      },
      layers: [ layer ]
    });

    const view = new MapView({
      container: "viewDiv",
      map,
      extent: {
        spatialReference: {
          latestWkid: 3857,
          wkid: 102100
        },
        xmin: -15327459,
        ymin: 2740044,
        xmax: -6076744,
        ymax: 6878650
      },
      popup: {
        dockEnabled: true,
        dockOptions: {
          breakpoint: false,
          position: "top-right"
        }
      }
    });

    view.ui.add( new Expand({
      content: new Legend({ view }),
      view
    }), "top-left");

    layer
      .when()
      .then(generateClusterConfig)
      .then( async (featureReduction) => {

        // sets generated cluster configuration on the layer
        layer.featureReduction = featureReduction;

        // the layer view is needed for querying clusters
        layerView = await view.whenLayerView(layer);

        // Disable clustering when user zooms beyond a 1:50,000 scale level
        // Re-enable clustering when the user zooms out to a scale smaller than 1:50,000
        view.watch("scale", (scale) => {
          layer.featureReduction = view.scale > 50000 ? featureReduction : null;
        });
      })
      .catch((error) => {
        console.error(error);
      });

    async function generateClusterConfig(layer) {
      // generates default popupTemplate
      const popupTemplate =
        await clusterPopupCreator
          .getTemplates({
            layer
          })
          .then((popupTemplateResponse) => popupTemplateResponse.primaryTemplate.value);

      // Add actions for exploring the features of each cluster
      popupTemplate.actions = [
        {
          title: "Statistics",
          id: "statistics",
          className: "esri-icon-line-chart"
        },
        {
          title: "Convex hull",
          id: "convex-hull",
          className: "esri-icon-polygon"
        },
        {
          title: "Show features",
          id: "show-features",
          className: "esri-icon-maps"
        }
      ];

      // generates default labelingInfo
      const { labelingInfo, clusterMinSize } =
        await clusterLabelCreator
          .getLabelSchemes({
            layer, view
          })
          .then((labelSchemes) => labelSchemes.primaryScheme);

      return {
        type: "cluster",
        popupTemplate,
        labelingInfo,
        clusterMinSize
      };
    }

    view.popup.on("trigger-action", (event) => {
      clearViewGraphics();

      const popup = view.popup;
      const selectedFeature = popup.selectedFeature && popup.selectedFeature.isAggregate

      const id = event.action.id;

      if(id === "convex-hull"){
        displayConvexHull(view.popup.selectedFeature);
      }
      if(id === "show-features"){
        displayFeatures(view.popup.selectedFeature);
      }
      if(id === "statistics"){
        calculateStatistics(view.popup.selectedFeature);
      }
    });

    watchUtils.watch(view, ["scale", "popup.selectedFeature", "popup.visible"], clearViewGraphics);

    let convexHullGraphic = null;
    let clusterChildGraphics = [];

    function clearViewGraphics(){
      view.graphics.remove(convexHullGraphic);
      view.graphics.removeMany(clusterChildGraphics);
    }

    // displays all features from a given cluster in the view
    async function displayFeatures(graphic){
      processParams(graphic, layerView);


      const query = layerView.createQuery();
      query.aggregateIds = [graphic.getObjectId()];
      const { features } = await layerView.queryFeatures(query);


      features.forEach( async (feature) => {
        const symbol = await symbolUtils.getDisplayedSymbol(feature)
        feature.symbol = symbol;
        view.graphics.add(feature);
      });
      clusterChildGraphics = features;
    }


    async function displayConvexHull(graphic){
      processParams(graphic, layerView);

      const query = layerView.createQuery();
      query.aggregateIds = [graphic.getObjectId()];
      const { features } = await layerView.queryFeatures(query);
      const geometries = features.map( feature => feature.geometry );
      const [ convexHull ] = geometryEngine.convexHull(geometries, true);

      convexHullGraphic = new Graphic({
        geometry: convexHull,
        symbol: {
          type: "simple-fill",
          outline: {
            width: 1.5,
            color: [ 75, 75, 75, 1 ]
          },
          style: "none",
          color: [ 0, 0, 0, 0.1 ]
        }
      });
      view.graphics.add(convexHullGraphic);
    }


    // calculates set statistics for features in a cluster
    // and displays them in the cluster popup

    async function calculateStatistics(graphic){
      processParams(graphic, layerView);

      const query = layerView.createQuery();

      query.aggregateIds = [graphic.getObjectId()];

      query.groupByFieldsForStatistics = [ "fuel1" ];
      query.outFields = [ "capacity_mw", "fuel1" ];
      query.orderByFields = [ "num_features desc" ];
      query.outStatistics = [
        {
          onStatisticField: "capacity_mw",
          outStatisticFieldName: "capacity_total",
          statisticType: "sum"
        },
        {
          onStatisticField: "1",
          outStatisticFieldName: "num_features",
          statisticType: "count"
        },
        {
          onStatisticField: "capacity_mw",
          outStatisticFieldName: "capacity_max",
          statisticType: "max"
        }
      ];

      const { features } = await layerView.queryFeatures(query);
      const stats = features.map( feature => feature.attributes);


      let table = `
        <div class="table-container">
          <span style="font-size: 14pt"><strong>Summary by fuel type</strong></span>
          <br/>
          <br/>
          <table class="esri-widget popup">
            <tr class="head"><td>Fuel</td><td>Count</td><td>Capacity (mW)</td><td>Largest plant (mW)</td></tr>
      `;

      let totalCapacity = 0;
      let totalCount = 0;

      stats.forEach( stat => {
        const fuel = stat.fuel1;
        const total = stat.capacity_total;
        const max = stat.capacity_max;
        const count = stat.num_features;

        totalCapacity += total;
        totalCount += count;

        table += `
          <tr><td><span style:'font-weight:bolder'>${fuel}</span></td><td class="num">${count}</td><td class="num">${roundDecimals(total, 2).toLocaleString()}</td><td class="num">${roundDecimals(max, 2).toLocaleString()}</td></tr>
        `;
      });

      table += `
        </table>
      </div>`;

      view.popup.content = `
        <div style="font-size: 12pt">
        Number of features: <strong>${totalCount.toLocaleString()}</strong><br>
        Total capacity (mW): <strong>${roundDecimals(totalCapacity, 2).toLocaleString()}</strong><br>
        </div><br>
      ` + table;
    }


    function processParams(graphic, layerView){
      if (!graphic || !layerView) {
        throw new Error("Graphic or layerView not provided.");
      }

      if (!graphic.isAggregate) {
        throw new Error("Graphic must represent a cluster.");
      }
    }

    function roundDecimals(num, places){
      return Math.round(num * Math.pow(10, places)) / Math.pow(10, places);
    }
  });
</script>
</head>

<body>
<div id="viewDiv"></div>
</body>
</html>