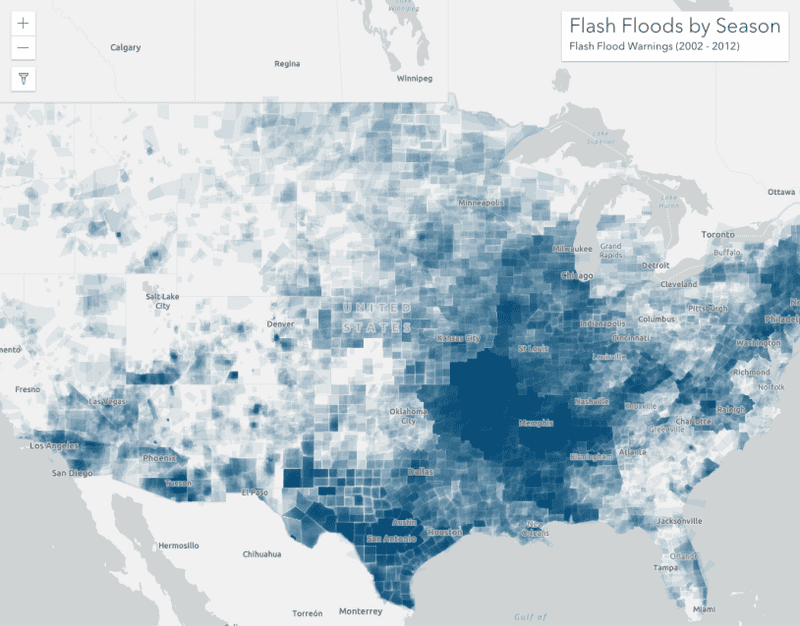
山洪警报(2002 - 2012 年)。所有警告区域都被赋予了相同的透明符号,这使得洪水活动更频繁的区域能够更清晰地显示出来。
聚类和热点图仅适用于点图层。当多边形重叠时,您可以使用每个要素的不透明度来可视化它们的密度。
什么是按要素的不透明度?
通过在所有要素上设置高度透明的符号,可以有效地可视化具有大量重叠要素的图层(至少 90-99% 的透明度效果最佳)。这对于显示许多面和折线相重叠的区域特别有效。
例如,下图显示了在 10 年内经历过山洪警报的地区。每个面代表一个持续时间为 1 到 12 小时的山洪警报区。每个都分配有一个蓝色填充符号,其 alpha 级别为 0.04(96% 透明度)。

可视化为高度透明面的山洪警报。不透明地区出现大量山洪警报。 透明区域的山洪警报较少。对于仅经历过一次山洪警报的区域,其不透明度值为 0.04。不止一次经历过警报的区域将具有更高的不透明度值,使其更明显。
如果未针对每个要素设置不透明度,则只能区分至少经历过一次山洪警报的区域。

可视化为不透明面的山洪警报。没有视觉提示表明哪个区域比其他区域经历更多的警报。无论您将所有数据存储在一个图层中,还是分隔为多个图层,此可视化技术均有效。在任一场景中,每个要素的透明度都会与其他重叠要素相乘,因此您可以轻松地查看与要素稀疏的区域相比,存在较高密度要素的位置。
按要素设置不透明度的工作原理
仅可通过代表每个要素的符号颜色属性在每个要素的基础上设置不透明度。这允许给定像素的不透明度在重叠要素之间成倍增加。
请注意以下代码片段中的颜色值。每个参数代表一个颜色通道(即 rgba(red, green, blue, alpha))。alpha(即不透明度)值必须是一个非常小的数字。根据要素的密度,介于 0.01 和 0.1 之间的数字通常效果最佳。
1
2
3
4
5
6
7
8
9
10
11
12
13
14
15
16
17
18
19
20
21
22
23
24
25
26
27
28
29
30
31
32
33
34
35
36
37
38
39
40
41
42
43
44
45
46
47
48
49
50
51
52
53
54
55
56
57
58
59
60
61
62
63
64
65
66
67
68
69
70
71
72
73
74
75
76
77
78
79
80
81
82
83
84
<!DOCTYPE html>
<html>

<head>
  <meta charset="utf-8" />
  <meta name="viewport" content="initial-scale=1,maximum-scale=1,user-scalable=no" />
  <title>Location style - polygons</title>

  <link rel="stylesheet" href="https://js.geoscene.cn/4.23/geoscene/themes/light/main.css" />
  <script src="https://js.geoscene.cn/4.23/"></script>

  <style>
    html,
    body,
    #viewDiv {
      padding: 0;
      margin: 0;
      height: 100%;
      width: 100%;
    }
    #titleDiv {
      padding: 10px;
    }

    #titleText {
      font-size: 20pt;
      font-weight: 60;
      padding-bottom: 10px;
    }
  </style>
  <script>
    require([
      "geoscene/views/MapView",
      "geoscene/Map",
      "geoscene/layers/FeatureLayer",
      "geoscene/renderers/SimpleRenderer",
      "geoscene/symbols/SimpleFillSymbol"
    ], function (
      MapView, Map, FeatureLayer, SimpleRenderer, SimpleFillSymbol
    ) {

      // flash flood warnings layer
      const layer = new FeatureLayer({
        portalItem: {
          id: "f9e348953b3848ec8b69964d5bceae02"
        }
      });


      layer.renderer = new SimpleRenderer({
        symbol: new SimpleFillSymbol({
          color: "rgba(0,76,115,0.04)",
          outline: null
        })
      });


      const map = new Map({
        basemap: "gray-vector",
        layers: [layer]
      });

      const view = new MapView({
        map,
        container: "viewDiv",
        center: [-98, 40],
        zoom: 3
      });
      view.ui.add("titleDiv", "top-right");

    });

  </script>
</head>

<body>
  <div id="viewDiv"></div>
  <div id="titleDiv" class="geoscene-widget">
    <div id="titleText">Flash Floods by Season</div>
    <div>Flash Flood Warnings (2002 - 2012)</div>
  </div>
</body>

</html>
示例
一个图层的面密度
以下示例演示了如何基于每个要素设置不透明度,以有效地显示重叠多边形的密度。
- 创建一个简单渲染器。
- 在颜色属性中使用非常小的 alpha 值(例如 0.01 - 0.1),以在渲染器中设置符号。
49
49
49
49
49
49
49
49
49
49
49
49
49
49
49
49
49
49
49
49
49
49
49
49
49
49
49
49
49
49
49
49
49
49
49
49
49
49
49
49
49
49
49
49
49
49
49
49
49
50
51
52
53
54
55
55
55
55
55
55
55
55
55
55
55
55
55
55
55
55
55
55
55
55
55
55
55
55
55
55
55
55
55
55
1
2
3
4
5
6
7
8
9
10
11
12
13
14
15
16
17
18
19
20
21
22
23
24
25
26
27
28
29
30
31
32
33
34
35
36
37
38
39
40
41
42
43
44
45
46
47
48
49
50
51
52
53
54
55
56
57
58
59
60
61
62
63
64
65
66
67
68
69
70
71
72
73
74
75
76
77
78
79
80
81
82
83
84
<!DOCTYPE html>
<html>

<head>
  <meta charset="utf-8" />
  <meta name="viewport" content="initial-scale=1,maximum-scale=1,user-scalable=no" />
  <title>Location style - polygons</title>

  <link rel="stylesheet" href="https://js.geoscene.cn/4.23/geoscene/themes/light/main.css" />
  <script src="https://js.geoscene.cn/4.23/"></script>

  <style>
    html,
    body,
    #viewDiv {
      padding: 0;
      margin: 0;
      height: 100%;
      width: 100%;
    }
    #titleDiv {
      padding: 10px;
    }

    #titleText {
      font-size: 20pt;
      font-weight: 60;
      padding-bottom: 10px;
    }
  </style>
  <script>
    require([
      "geoscene/views/MapView",
      "geoscene/Map",
      "geoscene/layers/FeatureLayer",
      "geoscene/renderers/SimpleRenderer",
      "geoscene/symbols/SimpleFillSymbol"
    ], function (
      MapView, Map, FeatureLayer, SimpleRenderer, SimpleFillSymbol
    ) {

      // flash flood warnings layer
      const layer = new FeatureLayer({
        portalItem: {
          id: "f9e348953b3848ec8b69964d5bceae02"
        }
      });


      layer.renderer = new SimpleRenderer({
        symbol: new SimpleFillSymbol({
          color: "rgba(0,76,115,0.04)",
          outline: null
        })
      });


      const map = new Map({
        basemap: "gray-vector",
        layers: [layer]
      });

      const view = new MapView({
        map,
        container: "viewDiv",
        center: [-98, 40],
        zoom: 3
      });
      view.ui.add("titleDiv", "top-right");

    });

  </script>
</head>

<body>
  <div id="viewDiv"></div>
  <div id="titleDiv" class="geoscene-widget">
    <div id="titleText">Flash Floods by Season</div>
    <div>Flash Flood Warnings (2002 - 2012)</div>
  </div>
</body>

</html>
山洪警报(2002 - 2012 年)。所有警报区域都被赋予了相同的透明符号,这使得洪水活动更频繁的区域能够更清晰地显示出来。
两个图层的面密度
您可能需要考虑多图层之间的要素密度。以下示例演示了如何显示代表燃烧地区的两个图层的面密度。由于图层相互叠加,我们可以在两个或多个图层的要素上设置相同的符号,以实现与上一个示例相同的可视化效果。
- 创建一个简单渲染器。
- 在渲染器中使用非常小的 alpha 值(例如 0.01 - 0.1)设置符号。
- 将相同的渲染器应用于表示相同或相似现象的两个或多个图层。
61
61
61
61
61
61
61
61
61
61
61
61
61
61
61
61
61
61
61
61
61
61
61
61
61
61
61
61
61
61
61
61
61
61
61
61
61
61
61
61
61
61
61
61
61
61
61
61
61
61
61
61
61
61
61
61
61
61
61
61
61
62
63
64
65
66
67
68
69
69
69
69
69
69
69
69
69
69
69
69
69
69
69
69
69
69
69
69
69
69
69
69
69
69
69
69
69
69
69
1
2
3
4
5
6
7
8
9
10
11
12
13
14
15
16
17
18
19
20
21
22
23
24
25
26
27
28
29
30
31
32
33
34
35
36
37
38
39
40
41
42
43
44
45
46
47
48
49
50
51
52
53
54
55
56
57
58
59
60
61
62
63
64
65
66
67
68
69
70
71
72
73
74
75
76
77
78
79
80
81
82
83
84
85
86
87
88
89
90
91
92
93
94
95
96
97
98
99
<!DOCTYPE html>
<html>

<head>
  <meta charset="utf-8" />
  <meta name="viewport" content="initial-scale=1,maximum-scale=1,user-scalable=no" />
  <title>Location style - polygons</title>

  <link rel="stylesheet" href="https://js.geoscene.cn/4.23/geoscene/themes/light/main.css" />
  <script src="https://js.geoscene.cn/4.23/"></script>

  <style>
    html,
    body,
    #viewDiv {
      padding: 0;
      margin: 0;
      height: 100%;
      width: 100%;
    }
    #titleDiv {
      padding: 10px;
    }

    #titleText {
      font-size: 20pt;
      font-weight: 60;
      padding-bottom: 10px;
    }
  </style>
  <script>
    require([
      "geoscene/views/MapView",
      "geoscene/WebMap",
      "geoscene/layers/FeatureLayer",
      "geoscene/renderers/SimpleRenderer",
      "geoscene/symbols/SimpleFillSymbol",
      "geoscene/widgets/LayerList"
    ], function (
      MapView, WebMap, FeatureLayer, SimpleRenderer, SimpleFillSymbol, LayerList
    ) {


      const burnsLayer = new FeatureLayer({
        title: "Burn areas",
        url: "https://services.arcgis.com/jIL9msH9OI208GCb/arcgis/rest/services/California_Fire_Perimeters_1878_2019/FeatureServer",
        layerId: 1,
        opacity: 1,
        blendMode: "multiply"
      });


      const prescribedLayer = new FeatureLayer({
        title: "Prescribed burns",
        url: "https://services.arcgis.com/jIL9msH9OI208GCb/arcgis/rest/services/California_Fire_Perimeters_1878_2019/FeatureServer",
        layerId: 2,
        opacity: 1,
        blendMode: "multiply"
      });


      const renderer = new SimpleRenderer({
        symbol: new SimpleFillSymbol({
          color: "rgba(168, 0, 0, 0.17)",
          outline: null
        })
      });
      burnsLayer.renderer = renderer;
      prescribedLayer.renderer = renderer;


      const map = new WebMap({
        portalItem: {
          id: "16bbd616637c4af29683d45eff023dfa"
        },
        layers: [ burnsLayer, prescribedLayer ]
      });

      const view = new MapView({
        map,
        container: "viewDiv"
      });
      view.ui.add("titleDiv", "top-right");
      view.ui.add(new LayerList({ view }), "top-right");

    });

  </script>
</head>

<body>
  <div id="viewDiv"></div>
  <div id="titleDiv" class="geoscene-widget">
    <div id="titleText">California fires</div>
    <div>Burn areas (1878 - 2020)</div>
  </div>
</body>

</html>
加州燃烧地区(1878 - 2020 年)。此可视化效果显示了哪些区域经历了更多的火灾,无论是定期的、自然的还是意外的。
多种类型的密度
以下示例演示了如何显示代表不同类型要素的两个图层的面密度。此应用程序可视化了 10 年内所有收到山洪和龙卷风警告的位置。山洪警告以透明的蓝色填充符号表示,龙卷风警告以透明的橙色符号表示。
这使您可以查看洪水密度较高的区域、龙卷风密度较高的区域以及两者密度均高的区域。
- 创建两个简单渲染器对象。
- 在每个渲染器中使用不同颜色设置符号。颜色必须是不同的色调,但颜色的 alpha 值应使用相同的值(例如 0.01 - 0.1)。
- 将每个渲染器应用于其各自的图层。
- 在最顶部的图层中,设置
average 混合模式。 这将平均位于其下方的所有图层的颜色。这确保了最顶部的图层不会仅因为图层在地图中的顺序而主导可视化。
山洪和龙卷风预警区(2002 - 2012 年)。具有相同透明度但不同色调的符号应用于每一图层。这允许最终用户查看经历过高密度山洪警报或龙卷风警报或两者兼有的区域。
60
60
60
60
60
60
60
60
60
60
60
60
60
60
60
60
60
60
60
60
60
60
60
60
60
60
60
60
60
60
60
60
60
60
60
60
60
60
60
60
60
60
60
60
60
60
60
60
60
60
60
60
60
60
60
60
60
60
60
60
61
62
63
64
65
66
67
68
69
70
71
72
73
74
74
74
74
74
74
74
74
74
74
74
74
74
74
74
74
74
74
74
74
74
74
74
74
74
74
74
74
74
74
74
74
74
74
1
2
3
4
5
6
7
8
9
10
11
12
13
14
15
16
17
18
19
20
21
22
23
24
25
26
27
28
29
30
31
32
33
34
35
36
37
38
39
40
41
42
43
44
45
46
47
48
49
50
51
52
53
54
55
56
57
58
59
60
61
62
63
64
65
66
67
68
69
70
71
72
73
74
75
76
77
78
79
80
81
82
83
84
85
86
87
88
89
90
91
92
93
94
95
96
97
98
99
100
101
102
103
104
105
106
107
<!DOCTYPE html>
<html>

<head>
  <meta charset="utf-8" />
  <meta name="viewport" content="initial-scale=1,maximum-scale=1,user-scalable=no" />
  <title>Location style - polygons</title>

  <link rel="stylesheet" href="https://js.geoscene.cn/4.23/geoscene/themes/light/main.css" />
  <script src="https://js.geoscene.cn/4.23/"></script>

  <style>
    html,
    body,
    #viewDiv {
      padding: 0;
      margin: 0;
      height: 100%;
      width: 100%;
    }
    #titleDiv {
      padding: 10px;
    }

    #titleText {
      font-size: 20pt;
      font-weight: 60;
      padding-bottom: 10px;
    }
  </style>
  <script>
    require([
      "geoscene/views/MapView",
      "geoscene/Map",
      "geoscene/layers/FeatureLayer",
      "geoscene/layers/GroupLayer",
      "geoscene/renderers/SimpleRenderer",
      "geoscene/symbols/SimpleFillSymbol",
      "geoscene/widgets/LayerList"
    ], function (
      MapView, Map, FeatureLayer, GroupLayer, SimpleRenderer, SimpleFillSymbol, LayerList
    ) {

      // flash flood warnings layer
      const floods = new FeatureLayer({
        title: "Flash flood warnings",
        portalItem: {
          id: "f9e348953b3848ec8b69964d5bceae02"
        },
        renderer: new SimpleRenderer({
          symbol: new SimpleFillSymbol({
            color: "rgba(0,76,115,0.03)",
            outline: null
          })
        }),
        popupEnabled: false,
        blendMode: "average"
      });


      const tornadoes = new FeatureLayer({
        title: "Tornado warnings",
        portalItem: {
          id: "105fee001d244d33b90bf3ae5a243679"
        },
        popupEnabled: false,
        blendMode: "average",
        renderer: new SimpleRenderer({
          symbol: new SimpleFillSymbol({
            color: "rgba(255, 128, 26,0.03)",
            outline: null
          })
        })
      });


      const map = new Map({
        basemap: "gray-vector",
        layers: [ new GroupLayer({
          title: "Severe weather warnings",
          layers: [floods, tornadoes]
        })]
      });

      const view = new MapView({
        map,
        container: "viewDiv",
        center: [-98, 40],
        zoom: 4
      });
      view.ui.add("titleDiv", "top-right");
      view.ui.add(new LayerList({ view }), "top-right");

    });

  </script>
</head>

<body>
  <div id="viewDiv"></div>
  <div id="titleDiv" class="geoscene-widget">
    <div id="titleText">Severe weather warnings</div>
    <div>Flash Floods and tornadoes (2002 - 2012)</div>
  </div>
</body>

</html>
API 支持
下表描述了非常适合每种可视化技术的几何和视图类型。
全部支持部分支持不支持