光晕
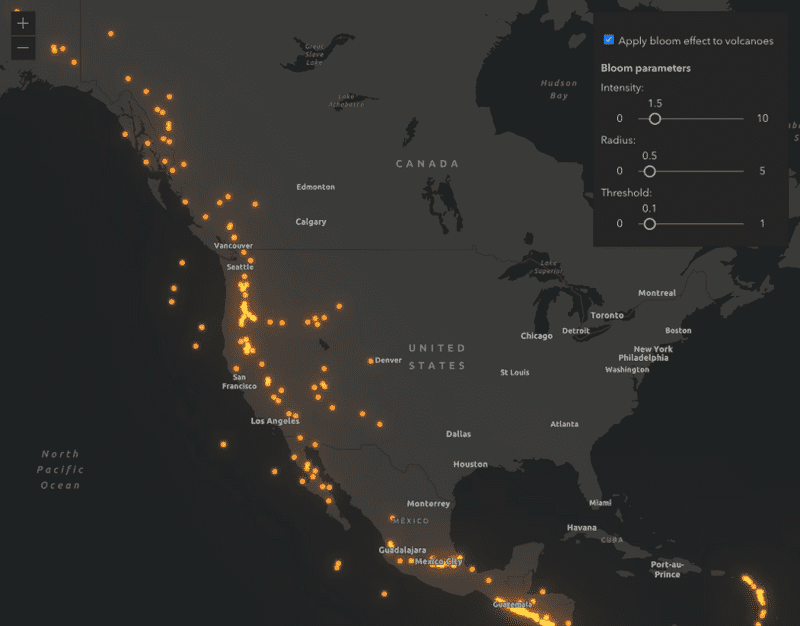
4.0 级及以上地震(1970 - 2019 年)。较亮区域表示该区的地震比其他区域多。
什么是光晕?
光晕是一种图层效果,可使表示图层要素的符号变亮,使它们看起来发光。这具有叠加效果,因此有更多要素重叠的区域将具有更亮和更强烈的光芒。这可使光晕成为可视化密集数据集的有效方法。
光晕的工作原理
光晕效果由三个参数控制,在深色背景上看起来最好。
bloom(strength, radius, threshold)
| 参数 | 说明 |
|---|---|
| strength | 将光晕效果的强度确定为因子或百分比。强度越高,光芒越亮。 |
| radius | 以像素为单位确定模糊的半径。 |
| threshold | 具有此亮度或更高亮度值的颜色将应用光晕效果。 |
光晕效果可能对比例、密度和颜色很敏感。有效地使用光晕通常是通过反复试验来完成的。适用于一个图层的参数往往不适用于其他图层。
示例
点
以下示例演示了如何使用光晕来显示表示近 50 年地震的重叠点的密度。
- 使用很小的符号创建简单渲染器(例如 1 或 2 个像素),并将其应用于图层。
- 在图层上设置光晕效果。在具有很多点的全球尺度下,半径应非常小(例如 0.1px)。阈值取决于渲染器的颜色选择。较低的数字可捕获更多的颜色(例如 15%)。
4.0 级及以上地震(1970 - 2019 年)。较亮区域表示该区的地震比其他区域多。
GeoScene JS API
39
39
39
39
39
39
39
39
39
39
39
39
39
39
39
39
39
39
39
39
39
39
39
39
39
39
39
39
39
39
39
39
39
39
39
39
39
39
39
40
41
42
43
44
45
46
47
48
49
50
51
52
53
54
54
54
54
54
54
54
54
54
54
54
54
54
54
54
54
54
54
54
54
54
54
54
54
54
54
54
54
54
54
54
54
54
54
54
54
54
54
54
54
54
54
54
54
54
54
54
54
54
54
54
54
54
54
54
54
54
54
54
54
54
54
54
54
54
54
54
54
54
54
54
54
线
以下示例演示了如何使用光晕来显示表示佛罗里达州高速公路的重叠线的密度。粗线和重叠的线将比细的非重叠线具有更亮的外观。
佛罗里达州高速公路的年平均每日交通流量。符号的颜色表示每条高速公路的管辖范围。
GeoScene JS API
38
38
38
38
38
38
38
38
38
38
38
38
38
38
38
38
38
38
38
38
38
38
38
38
38
38
38
38
38
38
38
38
38
38
38
38
38
38
39
40
41
42
43
44
44
44
44
44
44
44
44
44
44
44
44
44
44
44
44
44
44
44
44
44
44
44
44
44
相关示例和资源

API 支持
下表描述了非常适合每种可视化技术的几何和视图类型。