众数渲染
使用唯一值渲染器、视觉变量和 Arcade 表达式的人口普查区,以显示主要教育程度的收入
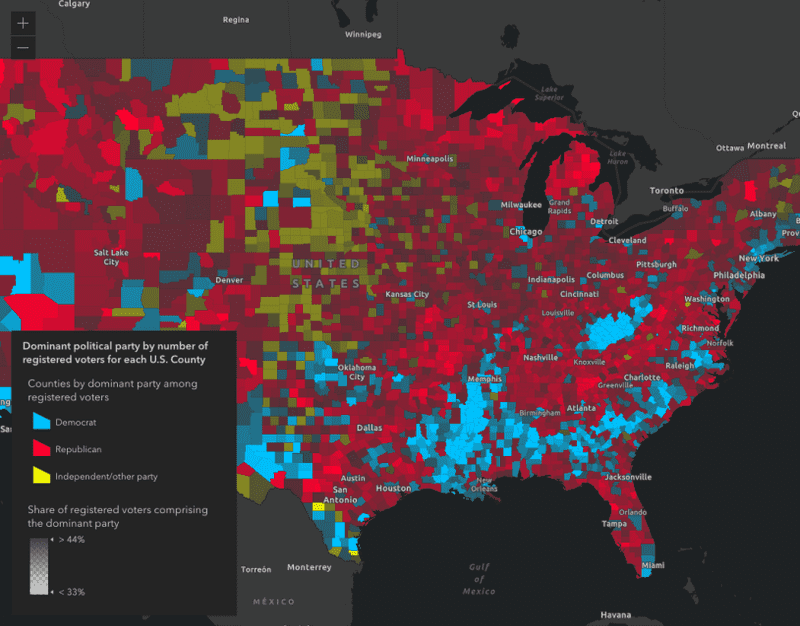
什么是众数渲染样式?
众数渲染样式可根据一组相似类别中具有最高(或主要)数量的类别为要素着色。您可以使用此样式来映射涉及较大人口子类别的任何内容。
- 选举的获胜者
- 在家中使用的主要语言
- 一个地区最常见的种族/民族
众数渲染样式的工作方式
此样式需要编写一个 Arcade 表达式来返回具有最大数值的类别。以下表达式返回一个字符串,表示给定要素的主要教育程度。
36
36
36
36
36
36
36
36
36
36
36
36
36
36
36
36
36
36
36
36
36
36
36
36
36
36
36
36
36
36
36
36
36
36
36
36
37
38
39
40
41
42
43
44
45
46
47
48
49
50
51
52
53
54
55
56
57
58
59
60
61
62
63
64
65
66
67
68
69
69
69
69
69
69
69
69
69
69
69
69
69
69
69
69
69
69
69
69
69
69
69
69
69
69
69
69
69
69
69
69
69
69
69
69
69
69
69
69
69
69
69
69
69
69
69
69
69
69
69
69
69
69
69
69
69
69
69
69
69
69
69
69
69
69
69
69
69
69
69
69
69
69
69
69
69
69
69
69
69
69
69
69
69
69
69
69
69
69
69
69
69
69
69
69
69
69
69
69
69
69
69
69
69
1
2
3
4
5
6
7
8
9
10
11
12
13
14
15
16
17
18
19
20
21
22
23
24
25
26
27
28
29
30
31
32
33
34
35
36
37
38
39
40
41
42
43
44
45
46
47
48
49
50
51
52
53
54
55
56
57
58
59
60
61
62
63
64
65
66
67
68
69
70
71
72
73
74
75
76
77
78
79
80
81
82
83
84
85
86
87
88
89
90
91
92
93
94
95
96
97
98
99
100
101
102
103
104
105
106
107
108
109
110
111
112
113
114
115
116
117
118
119
120
121
122
123
124
125
126
127
128
129
130
131
132
133
134
135
136
137
138
139
140
141
142
143
144
145
146
147
148
149
150
151
152
153
154
155
156
157
158
159
160
161
162
163
164
165
166
167
168
169
170
171
172
173
<!DOCTYPE html>
<html>
  <head>
    <meta charset="utf-8" />
    <meta
      name="viewport"
      content="initial-scale=1,maximum-scale=1,user-scalable=no"
    />

    <title>
      GeoScene Developer Guide: Predominance educational attainment
    </title>

    <link
      rel="stylesheet"
      href="https://js.geoscene.cn/4.23/geoscene/themes/light/main.css"
    />
    <script src="https://js.geoscene.cn/4.23/"></script>

    <style>
      html,
      body,
      #viewDiv {
        padding: 0;
        margin: 0;
        height: 100%;
        width: 100%;
      }
    </style>

    <!--ARCADE SCRIPTS-->

    <!--PREDOMINANT POLITICAL PARTY-->

    <script type="text/plain" id="predominance">

      // 将字段值存储在
      // 具有有意义名称的变量中。每个是
      // 达到每个教育级别的总人数

      var noHighSchool = $feature.NOHS_CY;
      var someHighSchool = $feature.SOMEHS_CY;
      var highSchool = $feature.HSGRAD_CY;
      var ged = $feature.GED_CY;
      var someCollege = $feature.SMCOLL_CY;
      var associates = $feature.ASSCDEG_CY;
      var bachelors = $feature.BACHDEG_CY;
      var grad = $feature.GRADDEG_CY;

      var all = [
        noHighSchool, someHighSchool, highSchool,
        ged, someCollege, associates,
        bachelors, grad,
      ];

      // 将最大值与相应字段的标签匹配
      // 并将其返回
      // 以在 UniqueValueRenderer 中使用

      return Decode( Max(all),
        noHighSchool, 'No high school',
        someHighSchool, 'Some high school',
        highSchool, 'High school diploma',
        ged, 'GED',
        someCollege, 'Some college',
        associates, 'Associate\'s degree',
        bachelors, 'Bachelor\'s degree',
        grad, 'Master\'s degree or higher',
      'n/a' );

    </script>

    <script>
      require([
        "geoscene/config",
        "geoscene/WebMap",
        "geoscene/views/MapView",
        "geoscene/layers/FeatureLayer",
        "geoscene/widgets/Legend",
        "geoscene/widgets/Expand"
      ], function (geosceneConfig,WebMap, MapView, FeatureLayer, Legend, Expand) {

        geosceneConfig.apiKey = "YOUR_API_KEY";

        function createSymbol(color) {
          return {
            type: "simple-fill",
            color: color,
            outline: {
              width: 0.3,
              color: [255, 255, 255, 0.2]
            }
          };
        }


        const colors = [ "#00b6f1", "#d9bf0d", "#6a28c7", "#c44245", "#b9a087", "#ab579d", "#78aea0", "#1e8553" ];
        const predominanceArcade = document.getElementById("predominance").text;
        const renderer = {
          type: "unique-value",
          valueExpression: predominanceArcade,
          valueExpressionTitle: "Predominant educational attainment",
          uniqueValueInfos: [
            {
              value: "Master's degree or higher",
              symbol: createSymbol(colors[0])
            }, {
              value: "Bachelor's degree",
              symbol: createSymbol(colors[1])
            }, {
              value: "Associate's degree",
              symbol: createSymbol(colors[2])
            }, {
              value: "Some college",
              symbol: createSymbol(colors[3])
            }, {
              value: "GED",
              symbol: createSymbol(colors[4])
            }, {
              value: "High school diploma",
              symbol: createSymbol(colors[5])
            }, {
              value: "Some high school",
              symbol: createSymbol(colors[6])
            }, {
              value: "No high school",
              symbol: createSymbol(colors[7])
            }
          ]
        };


        const layer = new FeatureLayer({
          portalItem: {
            id: "1cbb0faa0f1f424bbe213bfae9319309"
          },
          renderer: renderer,
          blendMode: "multiply"
        });

        const map = new WebMap({
          portalItem: {
            id: "9cf503b654144873a8e33f996f91ba1d"
          },
          layers: [ layer ]
        });

        const view = new MapView({
          container: "viewDiv",
          map: map,
          scale: 577790,
          center: [ -117.8099, 34.0441 ],
          constraints: {
            snapToZoom:false
          }
        });

        view.ui.add(new Expand({
          content: new Legend({
            view: view
          }),
          view: view,
          expanded: false
        }), "top-right");

      });
    </script>
  </head>

  <body>
    <div id="viewDiv"></div>
  </body>
</html>
创建表达式后,可创建唯一值渲染器并设置以下内容:
- 在
valueExpression属性中引用 Arcade 表达式。 - 为表达式返回的每个预期值创建唯一值信息对象。
示例
众数渲染值
以下示例根据 25 岁或以上成年人的主要受教育程度为每个人口普查区着色。
GeoScene JS API
96
96
96
96
96
96
96
96
96
96
96
96
96
96
96
96
96
96
96
96
96
96
96
96
96
96
96
96
96
96
96
96
96
96
96
96
96
96
96
96
96
96
96
96
96
96
96
96
96
96
96
96
96
96
96
96
96
96
96
96
96
96
96
96
96
96
96
96
96
96
96
96
96
96
96
96
96
96
96
96
96
96
96
96
96
96
96
96
96
96
96
96
96
96
96
96
97
98
99
100
101
102
103
104
105
106
107
108
109
110
111
112
113
114
115
116
117
118
119
120
121
122
123
124
125
126
127
128
129
130
130
130
130
130
130
130
130
130
130
130
130
130
130
130
130
130
130
130
130
130
130
130
130
130
130
130
130
130
130
130
130
130
130
130
130
130
130
130
130
130
130
130
130
1
2
3
4
5
6
7
8
9
10
11
12
13
14
15
16
17
18
19
20
21
22
23
24
25
26
27
28
29
30
31
32
33
34
35
36
37
38
39
40
41
42
43
44
45
46
47
48
49
50
51
52
53
54
55
56
57
58
59
60
61
62
63
64
65
66
67
68
69
70
71
72
73
74
75
76
77
78
79
80
81
82
83
84
85
86
87
88
89
90
91
92
93
94
95
96
97
98
99
100
101
102
103
104
105
106
107
108
109
110
111
112
113
114
115
116
117
118
119
120
121
122
123
124
125
126
127
128
129
130
131
132
133
134
135
136
137
138
139
140
141
142
143
144
145
146
147
148
149
150
151
152
153
154
155
156
157
158
159
160
161
162
163
164
165
166
167
168
169
170
171
172
173
<!DOCTYPE html>
<html>
  <head>
    <meta charset="utf-8" />
    <meta
      name="viewport"
      content="initial-scale=1,maximum-scale=1,user-scalable=no"
    />

    <title>
      GeoScene Developer Guide: Predominance educational attainment
    </title>

    <link
      rel="stylesheet"
      href="https://js.geoscene.cn/4.23/geoscene/themes/light/main.css"
    />
    <script src="https://js.geoscene.cn/4.23/"></script>

    <style>
      html,
      body,
      #viewDiv {
        padding: 0;
        margin: 0;
        height: 100%;
        width: 100%;
      }
    </style>

    <!--ARCADE SCRIPTS-->

    <!--PREDOMINANT POLITICAL PARTY-->

    <script type="text/plain" id="predominance">

      // store field values in variables with
      // meaningful names. Each is the total count
      // of people that attained each education level

      var noHighSchool = $feature.NOHS_CY;
      var someHighSchool = $feature.SOMEHS_CY;
      var highSchool = $feature.HSGRAD_CY;
      var ged = $feature.GED_CY;
      var someCollege = $feature.SMCOLL_CY;
      var associates = $feature.ASSCDEG_CY;
      var bachelors = $feature.BACHDEG_CY;
      var grad = $feature.GRADDEG_CY;

      var all = [
        noHighSchool, someHighSchool, highSchool,
        ged, someCollege, associates,
        bachelors, grad,
      ];

      // Match the maximum value with the label
      // of the respective field and return it for
      // use in a UniqueValueRenderer

      return Decode( Max(all),
        noHighSchool, 'No high school',
        someHighSchool, 'Some high school',
        highSchool, 'High school diploma',
        ged, 'GED',
        someCollege, 'Some college',
        associates, 'Associate\'s degree',
        bachelors, 'Bachelor\'s degree',
        grad, 'Master\'s degree or higher',
      'n/a' );

    </script>

    <script>
      require([
        "geoscene/config",
        "geoscene/WebMap",
        "geoscene/views/MapView",
        "geoscene/layers/FeatureLayer",
        "geoscene/widgets/Legend",
        "geoscene/widgets/Expand"
      ], function (geosceneConfig,WebMap, MapView, FeatureLayer, Legend, Expand) {

        geosceneConfig.apiKey = "YOUR_API_KEY";

        function createSymbol(color) {
          return {
            type: "simple-fill",
            color: color,
            outline: {
              width: 0.3,
              color: [255, 255, 255, 0.2]
            }
          };
        }


        const colors = [ "#00b6f1", "#d9bf0d", "#6a28c7", "#c44245", "#b9a087", "#ab579d", "#78aea0", "#1e8553" ];
        const predominanceArcade = document.getElementById("predominance").text;
        const renderer = {
          type: "unique-value",
          valueExpression: predominanceArcade,
          valueExpressionTitle: "Predominant educational attainment",
          uniqueValueInfos: [
            {
              value: "Master's degree or higher",
              symbol: createSymbol(colors[0])
            }, {
              value: "Bachelor's degree",
              symbol: createSymbol(colors[1])
            }, {
              value: "Associate's degree",
              symbol: createSymbol(colors[2])
            }, {
              value: "Some college",
              symbol: createSymbol(colors[3])
            }, {
              value: "GED",
              symbol: createSymbol(colors[4])
            }, {
              value: "High school diploma",
              symbol: createSymbol(colors[5])
            }, {
              value: "Some high school",
              symbol: createSymbol(colors[6])
            }, {
              value: "No high school",
              symbol: createSymbol(colors[7])
            }
          ]
        };


        const layer = new FeatureLayer({
          portalItem: {
            id: "1cbb0faa0f1f424bbe213bfae9319309"
          },
          renderer: renderer,
          blendMode: "multiply"
        });

        const map = new WebMap({
          portalItem: {
            id: "9cf503b654144873a8e33f996f91ba1d"
          },
          layers: [ layer ]
        });

        const view = new MapView({
          container: "viewDiv",
          map: map,
          scale: 577790,
          center: [ -117.8099, 34.0441 ],
          constraints: {
            snapToZoom:false
          }
        });

        view.ui.add(new Expand({
          content: new Legend({
            view: view
          }),
          view: view,
          expanded: false
        }), "top-right");

      });
    </script>
  </head>

  <body>
    <div id="viewDiv"></div>
  </body>
</html>使用透明度进行众数渲染
在众数渲染可视化中,即使主要值以最小临界胜过其他值,表示主要值的颜色也将以与任何相邻多边形相同的透明度和饱和度对整个多边形进行着色。
添加透明度变量有助于强调强主要值并消除主要值相对较弱的要素。Arcade 表达式可以返回主要值和第二位值之间的差距,或者其更简单一点,将主要值的份额作为所有值的百分比返回。
GeoScene JS API
129
129
129
129
129
129
129
129
129
129
129
129
129
129
129
129
129
129
129
129
129
129
129
129
129
129
129
129
129
129
129
129
129
129
129
129
129
129
129
129
129
129
129
129
129
129
129
129
129
129
129
129
129
129
129
129
129
129
129
129
129
129
129
129
129
129
129
129
129
129
129
129
129
129
129
129
129
129
129
129
129
129
129
129
129
129
129
129
129
129
129
129
129
129
129
129
129
129
129
129
129
129
129
129
129
129
129
129
129
129
129
129
129
129
129
129
129
129
129
129
129
129
129
129
129
129
129
129
129
130
131
132
133
134
135
136
137
138
139
140
141
142
143
144
145
146
147
148
148
148
148
148
148
148
148
148
148
148
148
148
148
148
148
148
148
148
148
148
148
148
148
148
148
148
148
148
148
148
148
148
148
148
148
148
148
148
148
148
148
148
148
1
2
3
4
5
6
7
8
9
10
11
12
13
14
15
16
17
18
19
20
21
22
23
24
25
26
27
28
29
30
31
32
33
34
35
36
37
38
39
40
41
42
43
44
45
46
47
48
49
50
51
52
53
54
55
56
57
58
59
60
61
62
63
64
65
66
67
68
69
70
71
72
73
74
75
76
77
78
79
80
81
82
83
84
85
86
87
88
89
90
91
92
93
94
95
96
97
98
99
100
101
102
103
104
105
106
107
108
109
110
111
112
113
114
115
116
117
118
119
120
121
122
123
124
125
126
127
128
129
130
131
132
133
134
135
136
137
138
139
140
141
142
143
144
145
146
147
148
149
150
151
152
153
154
155
156
157
158
159
160
161
162
163
164
165
166
167
168
169
170
171
172
173
174
175
176
177
178
179
180
181
182
183
184
185
186
187
188
189
190
191
<!DOCTYPE html>
<html>
  <head>
    <meta charset="utf-8" />
    <meta
      name="viewport"
      content="initial-scale=1,maximum-scale=1,user-scalable=no"
    />

    <title>
      GeoScene Developer Guide: Predominance with opacity
    </title>

    <link
      rel="stylesheet"
      href="https://js.geoscene.cn/4.23/geoscene/themes/light/main.css"
    />
    <script src="https://js.geoscene.cn/4.23/"></script>

    <style>
      html,
      body,
      #viewDiv {
        padding: 0;
        margin: 0;
        height: 100%;
        width: 100%;
      }
    </style>

    <!--ARCADE SCRIPTS-->

    <script type="text/plain" id="predominance">

      // store field values in variables with
      // meaningful names. Each is the total count
      // of people that attained each education level

      var noHighSchool = $feature.NOHS_CY;
      var someHighSchool = $feature.SOMEHS_CY;
      var highSchool = $feature.HSGRAD_CY;
      var ged = $feature.GED_CY;
      var someCollege = $feature.SMCOLL_CY;
      var associates = $feature.ASSCDEG_CY;
      var bachelors = $feature.BACHDEG_CY;
      var grad = $feature.GRADDEG_CY;

      var all = [
        noHighSchool, someHighSchool, highSchool,
        ged, someCollege, associates,
        bachelors, grad,
      ];

      // Match the maximum value with the label
      // of the respective field and return it for
      // use in a UniqueValueRenderer

      return Decode( Max(all),
        noHighSchool, 'No high school',
        someHighSchool, 'Some high school',
        highSchool, 'High school diploma',
        ged, 'GED',
        someCollege, 'Some college',
        associates, 'Associate\'s degree',
        bachelors, 'Bachelor\'s degree',
        grad, 'Master\'s degree or higher',
      'n/a' );

    </script>

    <script>
      require([
        "geoscene/config",
        "geoscene/WebMap",
        "geoscene/views/MapView",
        "geoscene/layers/FeatureLayer",
        "geoscene/widgets/Legend",
        "geoscene/widgets/Expand"
      ], function (geosceneConfig,WebMap, MapView, FeatureLayer, Legend, Expand) {
        geosceneConfig.apiKey = "YOUR_API_KEY";
        function createSymbol(color) {
          return {
            type: "simple-fill",
            color: color,
            outline: {
              width: 0.3,
              color: [255, 255, 255, 0.2]
            }
          };
        }


        const colors = [ "#00b6f1", "#d9bf0d", "#6a28c7", "#c44245", "#b9a087", "#ab579d", "#78aea0", "#1e8553" ];
        const predominanceArcade = document.getElementById("predominance").text;
        const renderer = {
          type: "unique-value",
          valueExpression: predominanceArcade,
          valueExpressionTitle: "Predominant educational attainment",
          uniqueValueInfos: [
            {
              value: "Master's degree or higher",
              symbol: createSymbol(colors[0])
            }, {
              value: "Bachelor's degree",
              symbol: createSymbol(colors[1])
            }, {
              value: "Associate's degree",
              symbol: createSymbol(colors[2])
            }, {
              value: "Some college",
              symbol: createSymbol(colors[3])
            }, {
              value: "GED",
              symbol: createSymbol(colors[4])
            }, {
              value: "High school diploma",
              symbol: createSymbol(colors[5])
            }, {
              value: "Some high school",
              symbol: createSymbol(colors[6])
            }, {
              value: "No high school",
              symbol: createSymbol(colors[7])
            }
          ]
        };


        renderer.visualVariables = [{
          type: "opacity",
          valueExpression: `
            var all = [
              $feature.NOHS_CY, $feature.SOMEHS_CY, $feature.HSGRAD_CY,
              $feature.GED_CY, $feature.SMCOLL_CY, $feature.ASSCDEG_CY,
              $feature.BACHDEG_CY, $feature.GRADDEG_CY
            ];
            var predominantValue = Max(all);
            var total = Sum(all);

            return (predominantValue / total) * 100;
          `,
          valueExpressionTitle: "% of people comprising the dominant educational attainment group",
          stops: [
            { value: 22, opacity: 0.05, label: "< 22%" },
            { value: 40, opacity: 1.0, label: "> 40%" }
          ]
        }];


        const layer = new FeatureLayer({
          portalItem: {
            id: "1cbb0faa0f1f424bbe213bfae9319309"
          },
          renderer: renderer,
          blendMode: "multiply"
        });

        const map = new WebMap({
          portalItem: {
            id: "9cf503b654144873a8e33f996f91ba1d"
          },
          layers: [ layer ]
        });

        const view = new MapView({
          container: "viewDiv",
          map: map,
          scale: 577790,
          center: [ -117.8099, 34.0441 ],
          constraints: {
            snapToZoom:false
          }
        });

        view.ui.add(new Expand({
          content: new Legend({
            view: view
          }),
          view: view,
          expanded: false
        }), "top-right");

      });
    </script>
  </head>

  <body>
    <div id="viewDiv"></div>
  </body>
</html>使用大小进行众数渲染
很多时候,在人口统计地图中,大型要素代表人口较少的区域。在众数渲染可视化中,这些大型要素的颜色可以主导视图,从而使它们看起来比实际更有影响力或更重要。
添加大小变量(该变量返回众数渲染表达式中考虑的所有类别的总和)有助于为用户提供额外的上下文。这需要从填充符号切换到标记符号。
这对于选举地图尤其重要,因为相对不重要的大型区域比人口密集区域更能占据视野。
GeoScene JS API
132
132
132
132
132
132
132
132
132
132
132
132
132
132
132
132
132
132
132
132
132
132
132
132
132
132
132
132
132
132
132
132
132
132
132
132
132
132
132
132
132
132
132
132
132
132
132
132
132
132
132
132
132
132
132
132
132
132
132
132
132
132
132
132
132
132
132
132
132
132
132
132
132
132
132
132
132
132
132
132
132
132
132
132
132
132
132
132
132
132
132
132
132
132
132
132
132
132
132
132
132
132
132
132
132
132
132
132
132
132
132
132
132
132
132
132
132
132
132
132
132
132
132
132
132
132
132
132
132
132
132
132
133
134
135
136
137
138
139
140
141
142
143
144
145
146
147
148
149
149
149
149
149
149
149
149
149
149
149
149
149
149
149
149
149
149
149
149
149
149
149
149
149
149
149
149
149
149
149
149
149
149
149
149
149
149
149
149
149
149
149
149
1
2
3
4
5
6
7
8
9
10
11
12
13
14
15
16
17
18
19
20
21
22
23
24
25
26
27
28
29
30
31
32
33
34
35
36
37
38
39
40
41
42
43
44
45
46
47
48
49
50
51
52
53
54
55
56
57
58
59
60
61
62
63
64
65
66
67
68
69
70
71
72
73
74
75
76
77
78
79
80
81
82
83
84
85
86
87
88
89
90
91
92
93
94
95
96
97
98
99
100
101
102
103
104
105
106
107
108
109
110
111
112
113
114
115
116
117
118
119
120
121
122
123
124
125
126
127
128
129
130
131
132
133
134
135
136
137
138
139
140
141
142
143
144
145
146
147
148
149
150
151
152
153
154
155
156
157
158
159
160
161
162
163
164
165
166
167
168
169
170
171
172
173
174
175
176
177
178
179
180
181
182
183
184
185
186
187
188
189
190
191
192
<!DOCTYPE html>
<html>
  <head>
    <meta charset="utf-8" />
    <meta
      name="viewport"
      content="initial-scale=1,maximum-scale=1,user-scalable=no"
    />

    <title>
      GeoScene Developer Guide: Predominance with size
    </title>

    <link
      rel="stylesheet"
      href="https://js.geoscene.cn/4.23/geoscene/themes/light/main.css"
    />
    <script src="https://js.geoscene.cn/4.23/"></script>

    <style>
      html,
      body,
      #viewDiv {
        padding: 0;
        margin: 0;
        height: 100%;
        width: 100%;
      }
    </style>

    <!--ARCADE SCRIPTS-->

    <script type="text/plain" id="predominance">

      // store field values in variables with
      // meaningful names. Each is the total count
      // of people that attained each education level

      var noHighSchool = $feature.NOHS_CY;
      var someHighSchool = $feature.SOMEHS_CY;
      var highSchool = $feature.HSGRAD_CY;
      var ged = $feature.GED_CY;
      var someCollege = $feature.SMCOLL_CY;
      var associates = $feature.ASSCDEG_CY;
      var bachelors = $feature.BACHDEG_CY;
      var grad = $feature.GRADDEG_CY;

      var all = [
        noHighSchool, someHighSchool, highSchool,
        ged, someCollege, associates,
        bachelors, grad,
      ];

      // Match the maximum value with the label
      // of the respective field and return it for
      // use in a UniqueValueRenderer

      return Decode( Max(all),
        noHighSchool, 'No high school',
        someHighSchool, 'Some high school',
        highSchool, 'High school diploma',
        ged, 'GED',
        someCollege, 'Some college',
        associates, 'Associate\'s degree',
        bachelors, 'Bachelor\'s degree',
        grad, 'Master\'s degree or higher',
      'n/a' );

    </script>

    <script>
      require([
        "geoscene/config",
        "geoscene/WebMap",
        "geoscene/views/MapView",
        "geoscene/layers/FeatureLayer",
        "geoscene/widgets/Legend",
        "geoscene/widgets/Expand"
      ], function (geosceneConfig,WebMap, MapView, FeatureLayer, Legend, Expand) {

        geosceneConfig.apiKey = "YOUR_API_KEY";

        function createSymbol(color) {
          return {
            type: "simple-marker",
            color: color,
            outline: {
              width: 0.3,
              color: [0, 0, 0, 0.2]
            }
          };
        }


        const colors = [ "#00b6f1", "#d9bf0d", "#6a28c7", "#c44245", "#b9a087", "#ab579d", "#78aea0", "#1e8553" ];
        const predominanceArcade = document.getElementById("predominance").text;
        const renderer = {
          type: "unique-value",
          valueExpression: predominanceArcade,
          valueExpressionTitle: "Predominant educational attainment",
          uniqueValueInfos: [
            {
              value: "Master's degree or higher",
              symbol: createSymbol(colors[0])
            }, {
              value: "Bachelor's degree",
              symbol: createSymbol(colors[1])
            }, {
              value: "Associate's degree",
              symbol: createSymbol(colors[2])
            }, {
              value: "Some college",
              symbol: createSymbol(colors[3])
            }, {
              value: "GED",
              symbol: createSymbol(colors[4])
            }, {
              value: "High school diploma",
              symbol: createSymbol(colors[5])
            }, {
              value: "Some high school",
              symbol: createSymbol(colors[6])
            }, {
              value: "No high school",
              symbol: createSymbol(colors[7])
            }
          ]
        };


        renderer.visualVariables = [{
          type: "size",
          valueExpression: `
            var all = [
              $feature.NOHS_CY, $feature.SOMEHS_CY, $feature.HSGRAD_CY,
              $feature.GED_CY, $feature.SMCOLL_CY, $feature.ASSCDEG_CY,
              $feature.BACHDEG_CY, $feature.GRADDEG_CY
            ];
            var total = Sum(all);
            return total;
          `,
          valueExpressionTitle: "Population 25+",
          minSize: "2px",
          maxSize: "48px",
          minDataValue: 1000,
          maxDataValue: 15000
        }];


        const layer = new FeatureLayer({
          portalItem: {
            id: "1cbb0faa0f1f424bbe213bfae9319309"
          },
          renderer: renderer,
          blendMode: "multiply"
        });

        const map = new WebMap({
          portalItem: {
            id: "9cf503b654144873a8e33f996f91ba1d"
          },
          layers: [ layer ]
        });

        const view = new MapView({
          container: "viewDiv",
          map: map,
          scale: 288895,
          center: [ -117.8099, 34.0441 ],
          constraints: {
            snapToZoom:false
          }
        });

        view.ui.add(new Expand({
          content: new Legend({
            view: view
          }),
          view: view,
          expanded: false
        }), "top-right");

      });
    </script>
  </head>

  <body>
    <div id="viewDiv"></div>
  </body>
</html>